


Instant AI Chart Generation
Create professional data visualizations in seconds. Just describe your data and watch the AI chart generator work its magic.
Turn your data into stunning, professional charts in seconds. Just upload your data, describe what you need, and watch the magic happen.
Try with sample data:
From startups in Silicon Valley to enterprises in Singapore, ChartGen powers data visualization for teams around the world.


The fastest AI-powered way to turn your business data into beautiful, professional chart visualizations.
Create professional data visualizations in seconds. Just describe your data and watch the AI chart generator work its magic.
No complex tools or coding required. Simply describe what chart you want in plain English and get results instantly.
Bar charts, line charts, pie charts, scatter plots, heatmaps, funnels, waterfalls, and more — all in one AI chart maker.
Connect to your data sources for real-time updates. Charts refresh automatically when your underlying data changes.
Download your charts as PNG, SVG, or PDF files. Embed directly into presentations, reports, and dashboards.
SOC 2 compliant with end-to-end encryption. Your business data stays secure and private at all times.
From financial reporting to marketing analytics, ChartGen transforms complex business data into professional, actionable visualizations that drive strategic decisions across all sectors.
Transform financial data into clear quarterly reports, revenue analysis, and profit visualizations that executives trust.
financial charts, revenue visualization, profit analysis, quarterly reports - AI chart generator for finance & accountingRevenue & Profit Margin Analysis
Visualize campaign performance, channel attribution, and ROI metrics to optimize your marketing spend.
marketing analytics, channel attribution, campaign ROI, conversion tracking - AI chart generator for marketing & growthQ4 2024 Channel Performance
From raw data to beautiful, professional data visualizations in under 30 seconds with our AI chart maker.
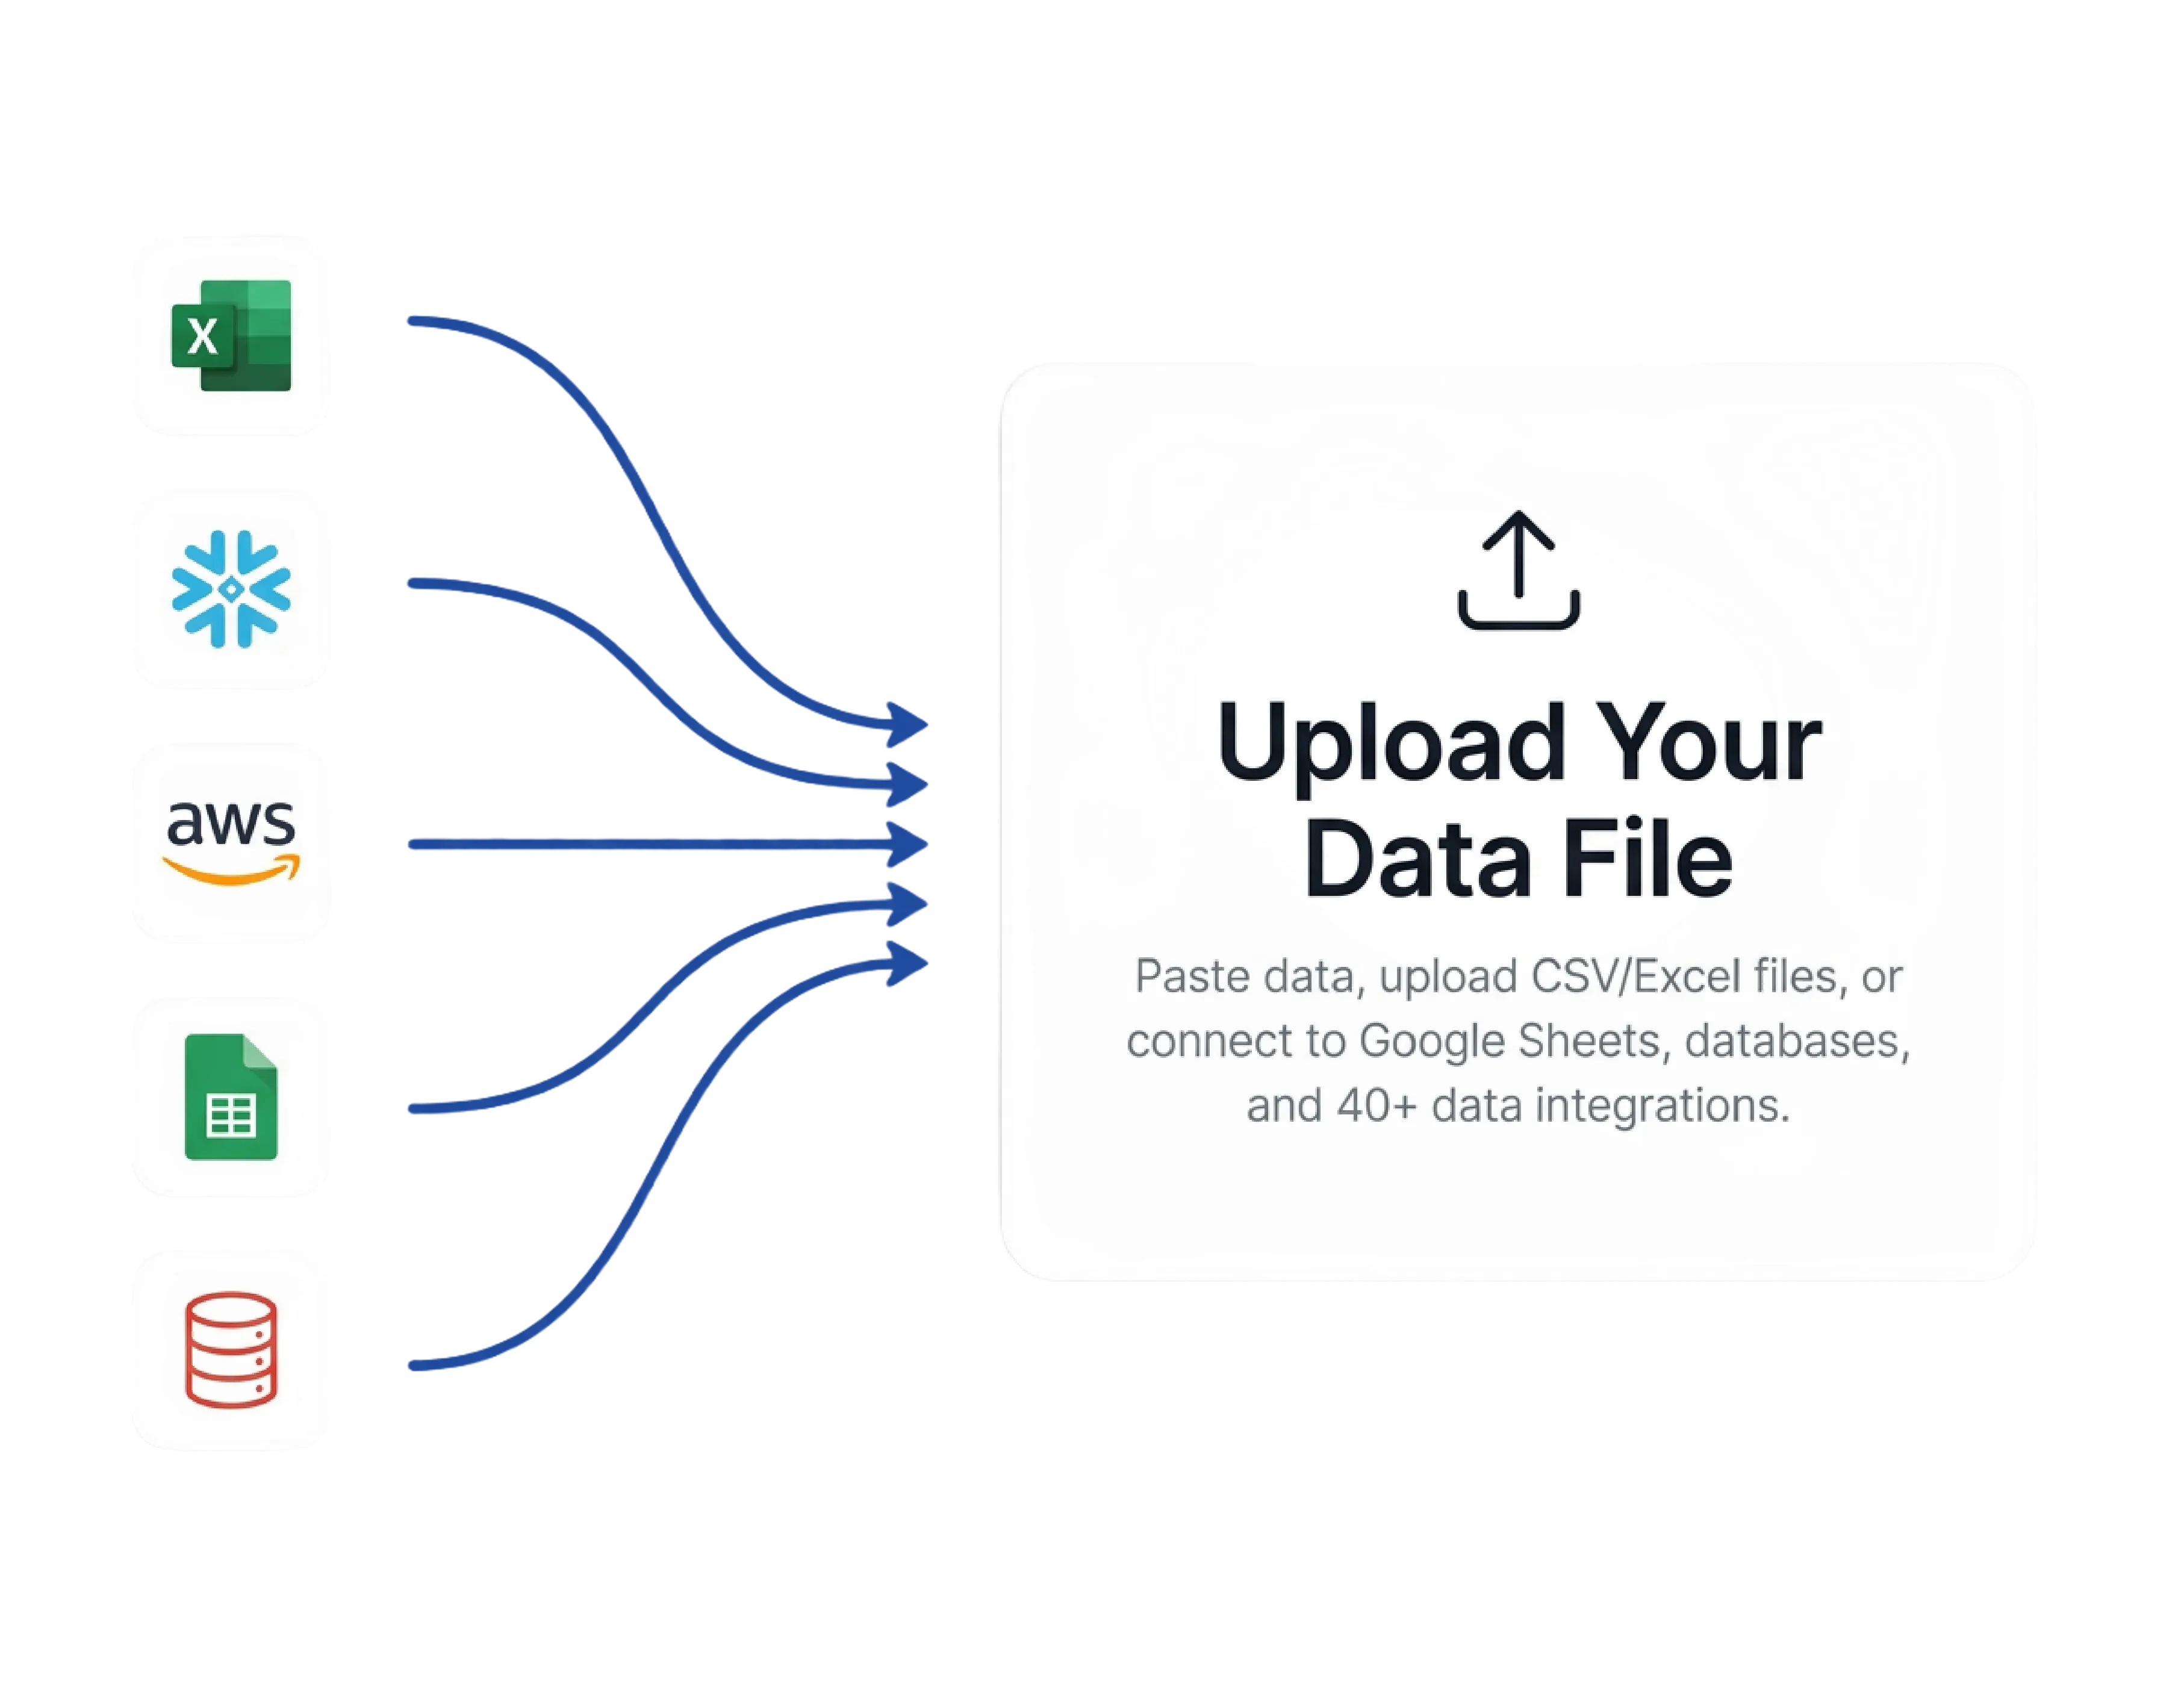
Upload Excel or CSV files, or connect your databases and data sources to start analyzing your data instantly. No complex setup required.
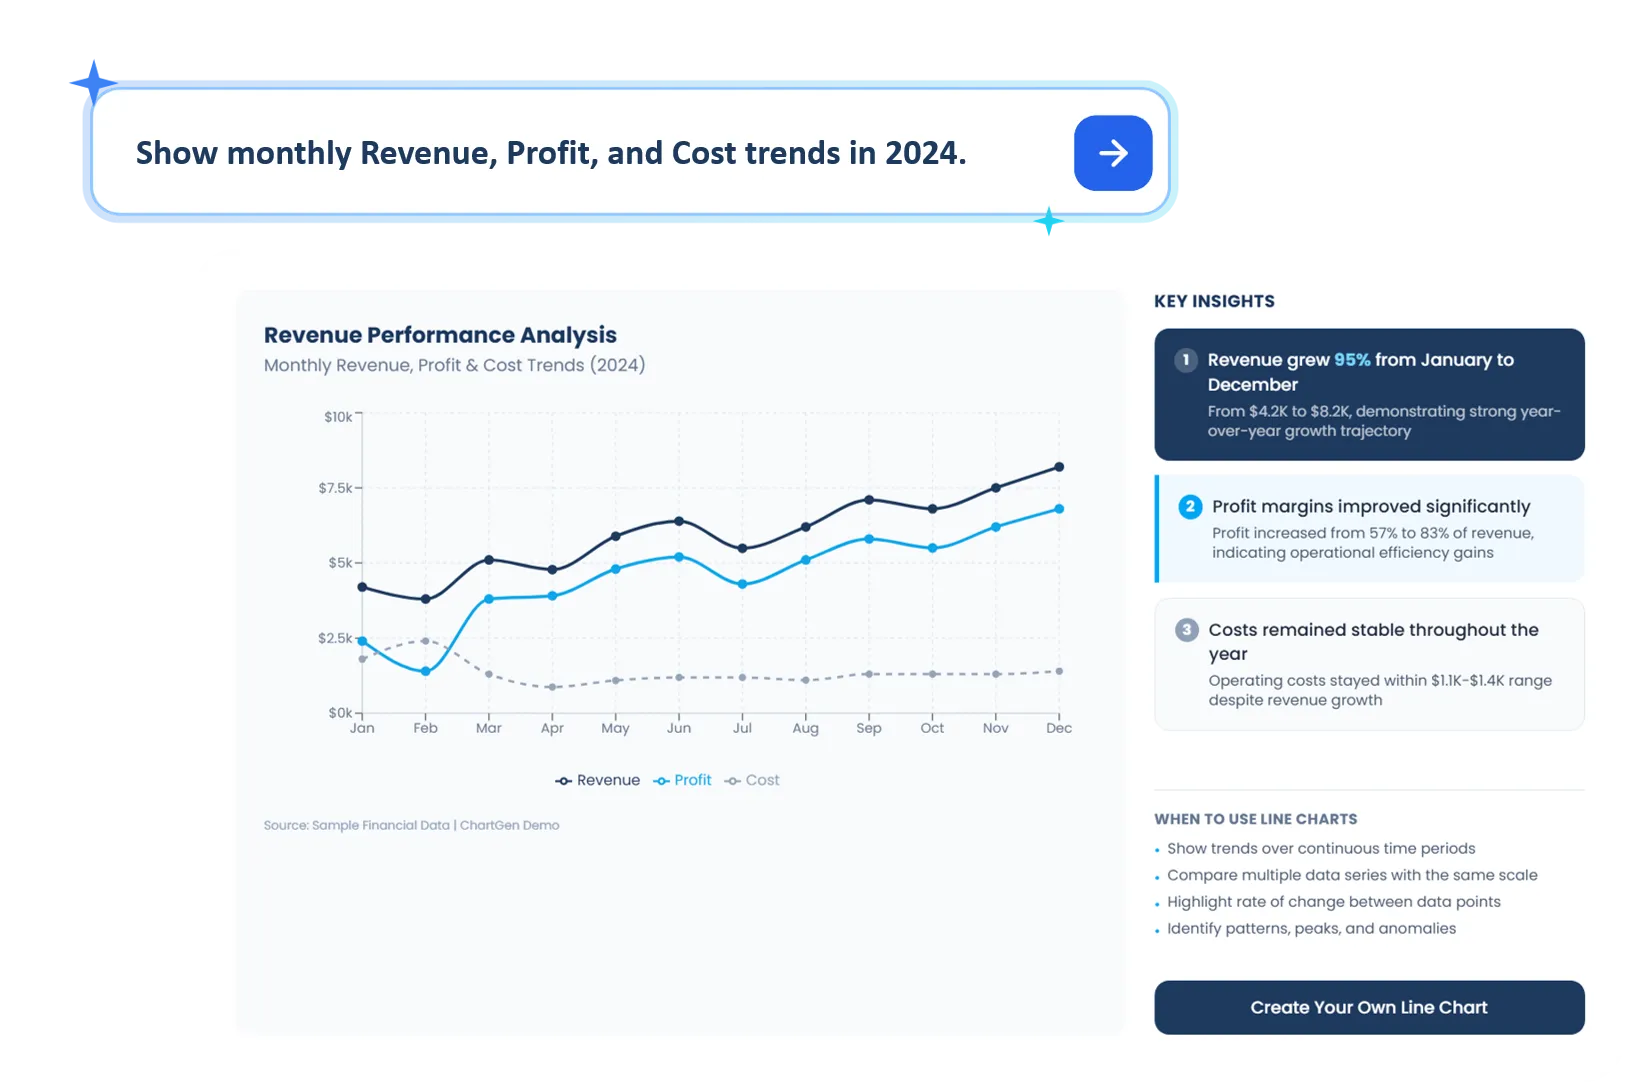
Use natural language to explore your data and automatically generate charts, reports, and key insights powered by AI.
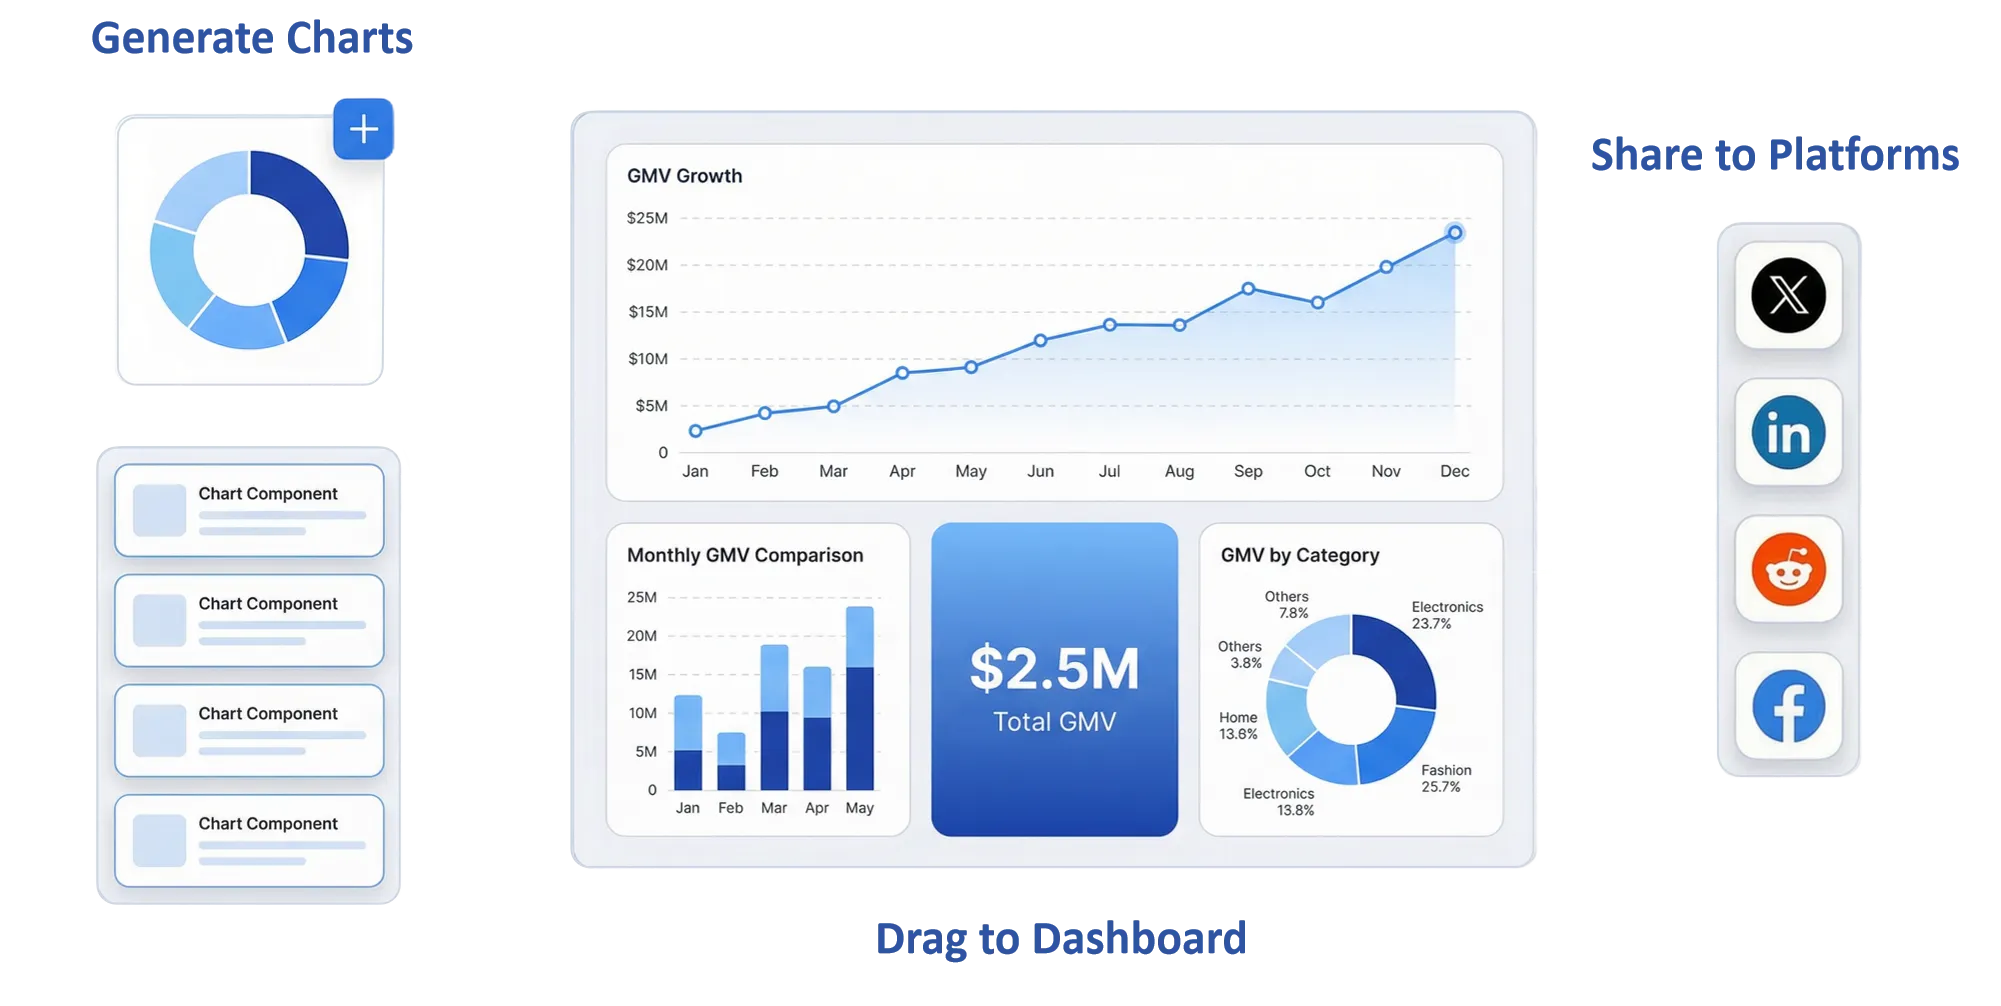
Publish your analysis to interactive dashboards and easily share insights with teammates, stakeholders, or clients.
Everything you need to know about our AI chart generator and data visualization tool
ChartGen is an AI-powered chart generator tool that transforms your data into beautiful, professional visualizations in seconds. Simply upload your CSV or Excel file, describe what chart you want in plain English, and our AI instantly creates stunning bar charts, line charts, pie charts, and more. No design or coding skills required.
Yes! ChartGen is a core product capability of Ada.im, a comprehensive data analysis intelligent agent platform. While ChartGen focuses specifically on AI chart generation and data visualization, Ada.im offers a full suite of data analysis tools including reports, dashboards, presentations, and more. You can explore the complete Ada.im platform at ada.im.
ChartGen supports CSV and Excel (.xlsx, .xls) file formats for data import. You can also paste data directly into the interface or connect to external data sources. Our AI automatically detects column types, dates, and numeric values to make chart creation seamless.
ChartGen supports 9 professional chart types: Bar Charts (vertical and horizontal), Line Charts, Pie Charts, Area Charts, Scatter Plots, Heatmaps, Combo Charts (bar + line), Waterfall Charts, and Funnel Charts. Each chart type can be customized with different color themes, labels, and data aggregation methods.
Our advanced AI analyzes your natural language description along with your data structure to determine the best chart type, select appropriate fields for categories and values, apply suitable aggregations (sum, average, count, etc.), and generate meaningful data insights. You can be as specific or general as you like in your requests.
ChartGen offers 12 professional color themes inspired by leading consulting firms like McKinsey. You can also use the built-in color picker to specify custom colors, and the AI will apply your preferred color palette to the generated chart automatically.
We support Sum, Average, Count, Min, Max, and Count Distinct aggregations for your data. The AI automatically selects the most appropriate aggregation method based on your data type and request, but you can easily change it in the configuration panel after chart generation.
Yes! You can download your generated charts as high-quality PNG images directly from ChartGen. For additional export options like SVG vector graphics, PDF documents, or direct embedding capabilities, you can sign up for a free account on Ada.im to access the full feature set.
Yes, your data security is our top priority. Your uploaded files are processed in real-time and are not permanently stored on our servers. All data transmission is encrypted using HTTPS, and we never share your data with third parties. ChartGen is SOC 2 compliant for enterprise use.
ChartGen offers free chart generation with basic features including 50 free charts per month and access to all chart types. For unlimited charts, advanced export options, team collaboration features, and access to the full Ada.im data analysis suite, you can upgrade to a premium plan.
Join thousands of analysts, marketers, and business leaders who create beautiful data visualizations with ChartGen — the fastest AI chart generator online.