사용 사례 돌아가기 템플릿 사용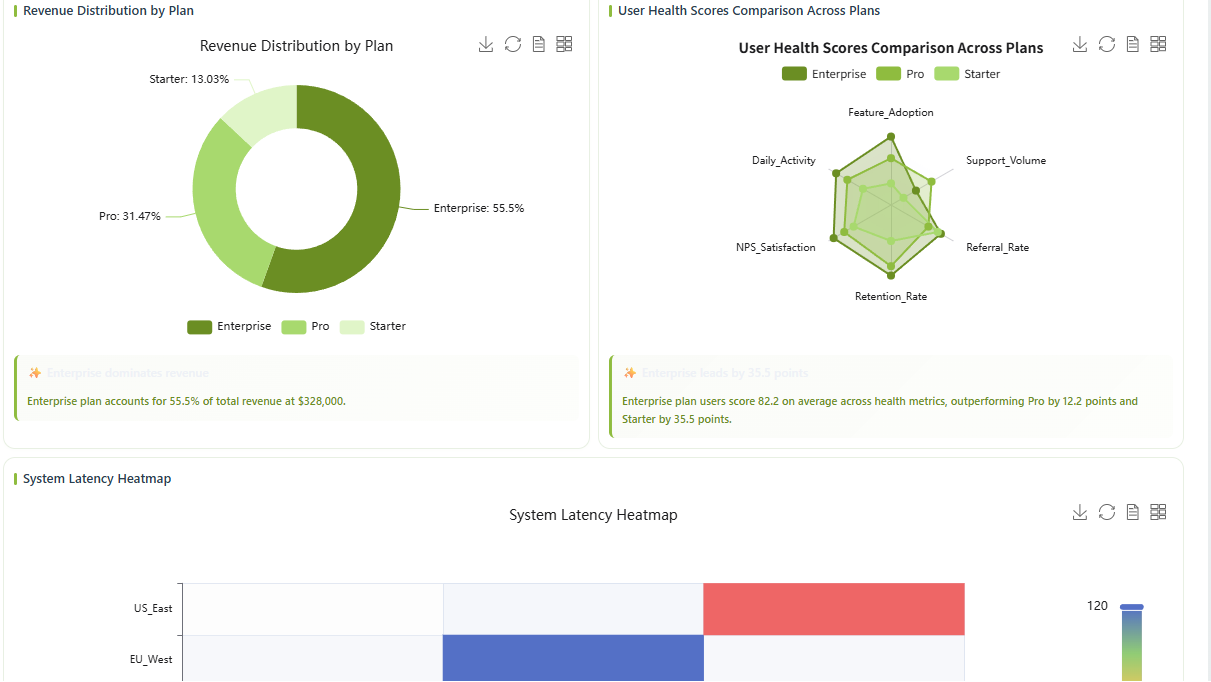
BUILD_DASHBOARD
H1 2024 SaaS Strategic Growth & Health Monitor
Description
Monitor key metrics across revenue, retention, and system latency in one view, so you can balance rapid growth with customer satisfaction and stability.
Input Settings
Action: dashboard
Recommended Prompt
Create a detailed SaaS Executive Dashboard with 4 distinct charts using the 2 provided data tables. Data Mapping: Table 1 (Monthly): Use for Chart 1 (Combo) and Chart 2 (Donut). Table 2 (Deep Dive): Use Columns A-D for Chart 3 (Radar). Use Columns F-H for Chart 4 (Heatmap). The overall color scheme is yellow-green.
Sample Datasets
Business_Monthly.csv
291 B
Deep_Dive_Data.csv
698 B
User_Health_Profile.csv
200 B