

사용 사례 돌아가기 템플릿 사용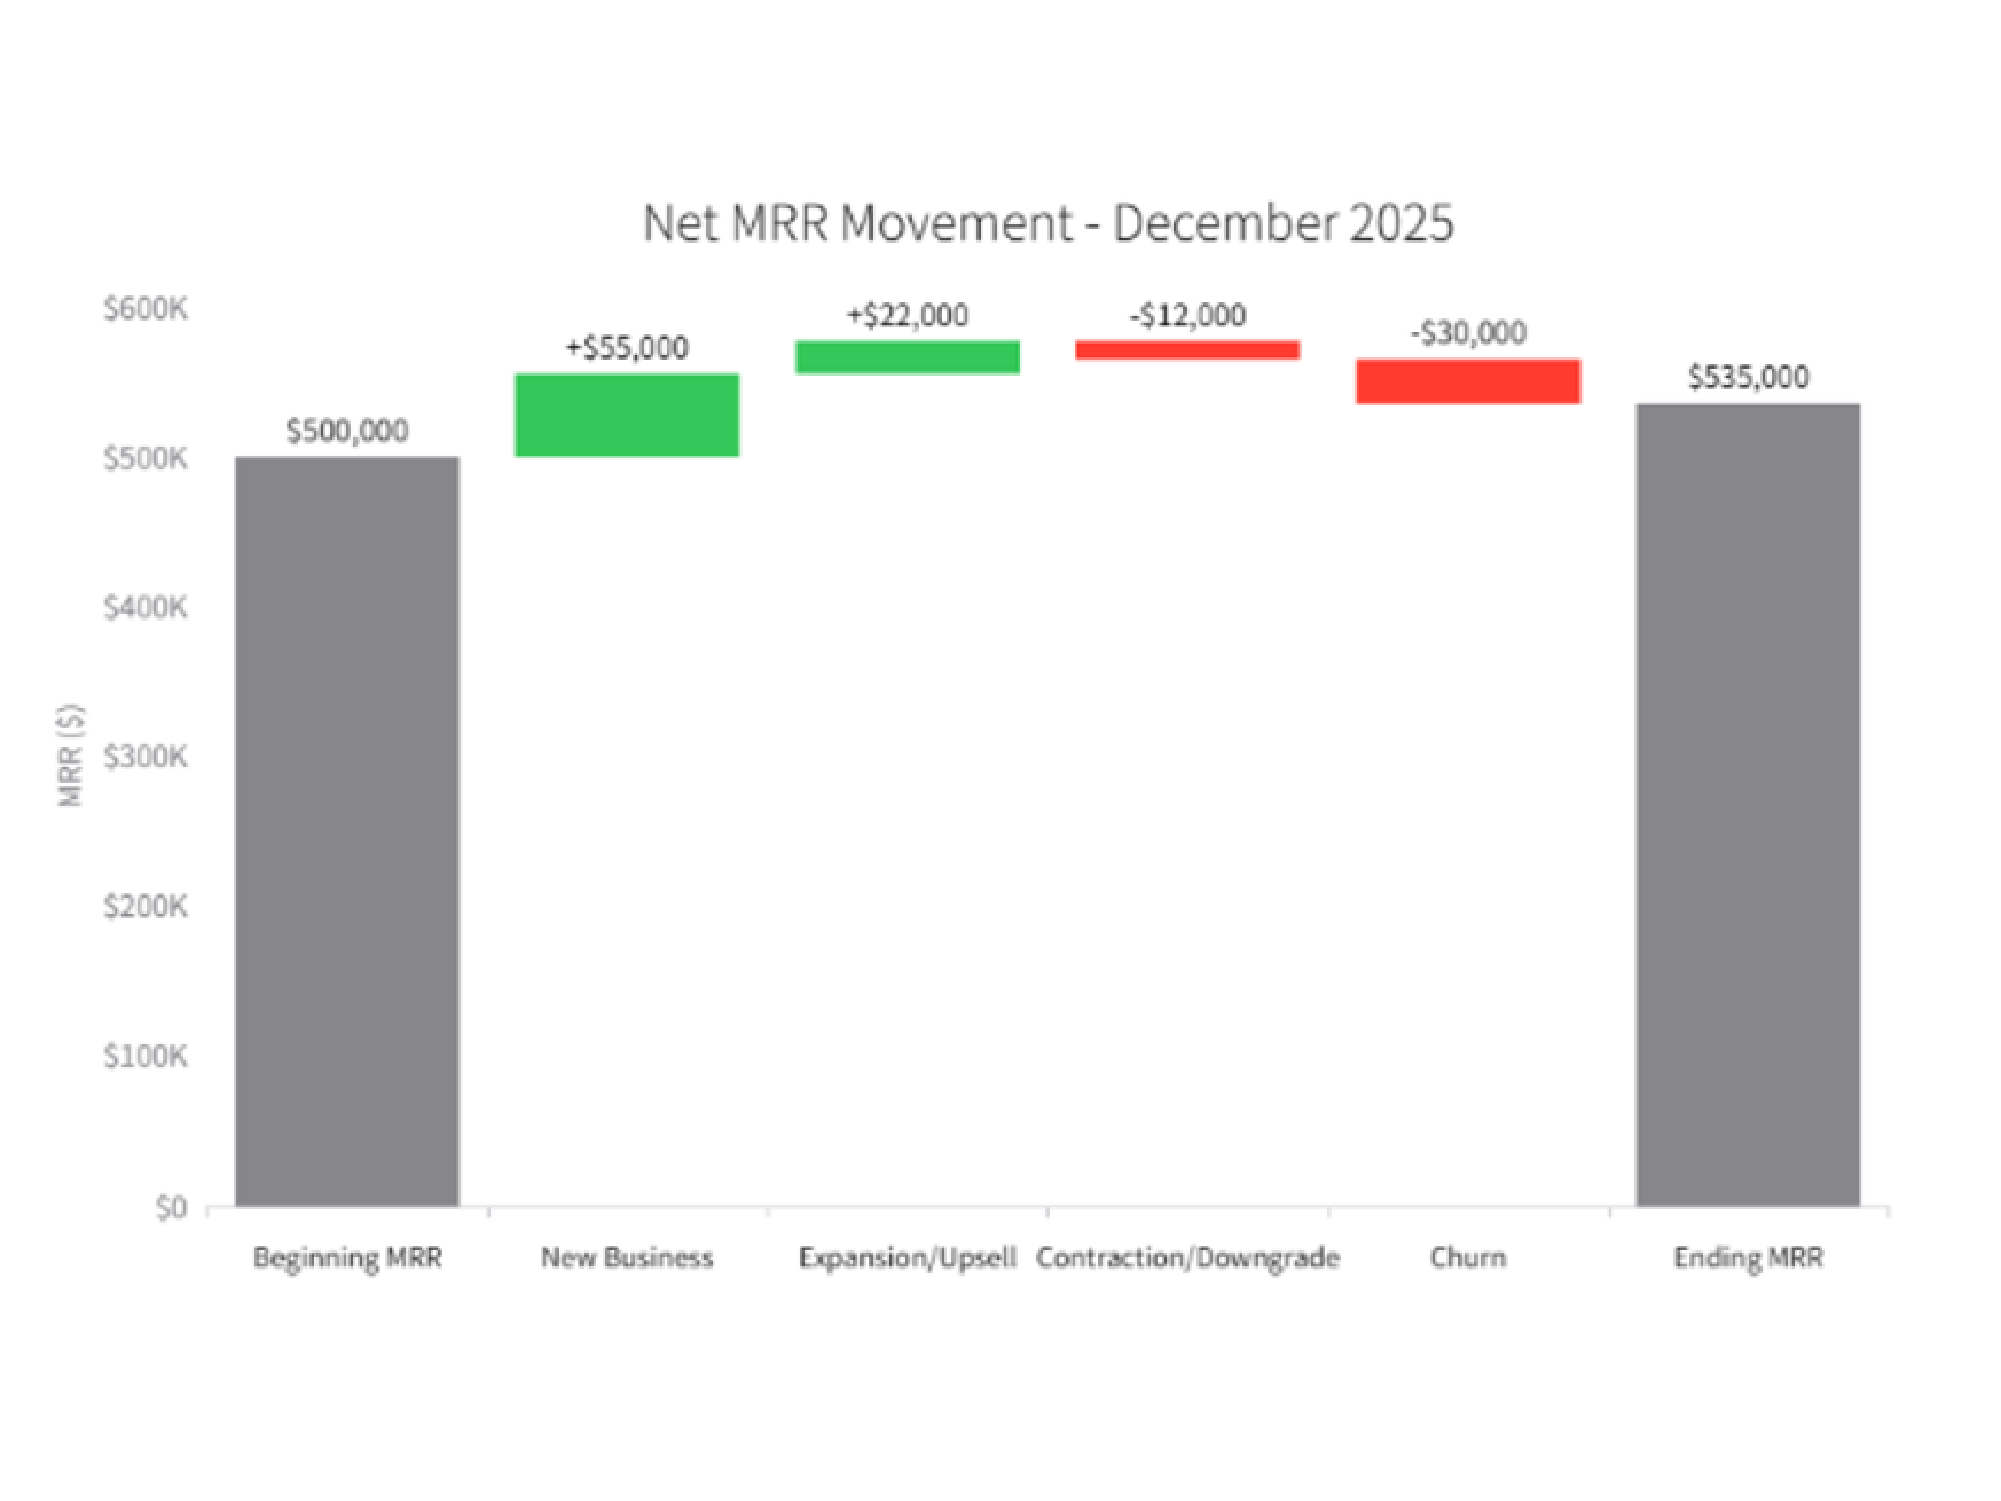
CREATE_CHART
Net MRR Movement
Description
This SaaS data visualization shows how new business, expansion, contraction, and churn contributed to last month's Net MRR movement.
Input Settings
Action: chartDeep Think: falseWeb Search: Disable
Recommended Prompt
Generate a Waterfall Chart (Bridge Chart) to explain the Net MRR (Monthly Recurring Revenue) movement for last month. Start Column: Beginning MRR. Flow Steps: New Business (Green, +) Expansion/Upsell (Green, +) Contraction/Downgrade (Red, -) Churn (Red, -) End Column: Ending MRR. Style: Use standard financial colors (Green for positive, Red for negative, Grey for Totals). Display the specific dollar amount change on top of each floating bar.