

ChartGen AI Feature Guide
Turn raw data and documents into professional charts, dashboards, and reports with a single sentence.
This guide takes you through your first analysis in 5 minutes and walks you through every core feature of ChartGen AI.
Run Your First Analysis in 5 Minutes
No SQL, no templates, no technical background needed. From uploading a file to complex reasoning, it's just three steps.
Quick Chat
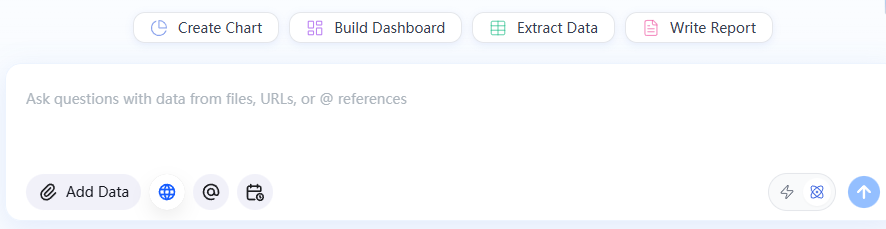
Drag a table (CSV / Excel) straight into the chat box, ask in plain language, and get an answer instantly — e.g. "Show total sales by month".
Best for quick lookupsCreate a Project
When you want to ask "why" or run multi-step analysis, click "Save as Project" or "+ Create Project" to enter a dedicated workspace.
Unlocks the semantic engineAsk Deeper Questions
Inside a Project you can ask complex questions: root-cause analysis, anomaly detection, and trend prediction.
Ask "why / what next"Which mode should I use?
- Quick Chat: answers "what" — reads the file directly, ideal for fast lookups and summaries.
- Project: answers "why / what next" — builds a semantic model that supports root-cause, prediction, and attribution.
Core Features at a Glance
An overview of ChartGen AI features. Pick a feature to jump to the detailed walkthrough below.
Analyze
Turn data into answers and insights.
Create
Produce ready-to-use deliverables.
Generate and edit charts
Combine multiple results
Full analysis narrative
Editable slide decks
Mind maps & flowcharts
Derive structured tables
Archive, search, version
Edit via conversation
Share with a link
Operationalize
Keep analysis compounding over time.
Connect
Bring data and integrations together.
See How Each Feature Works
Go beyond the feature map: each walkthrough explains what the feature is for, how to use it, and what to expect from the result, with screenshots for reference.
Natural-Language Data Query
No SQL or fixed keywords — just describe what you need. The system understands complex intent and industry terms, and auto-selects the best presentation: a summary number, a trend chart, or a detail table.
- "Show total revenue for the last 30 days"
- "Compare Q1 vs. Q2 sales performance by region"
Smart Interpretation
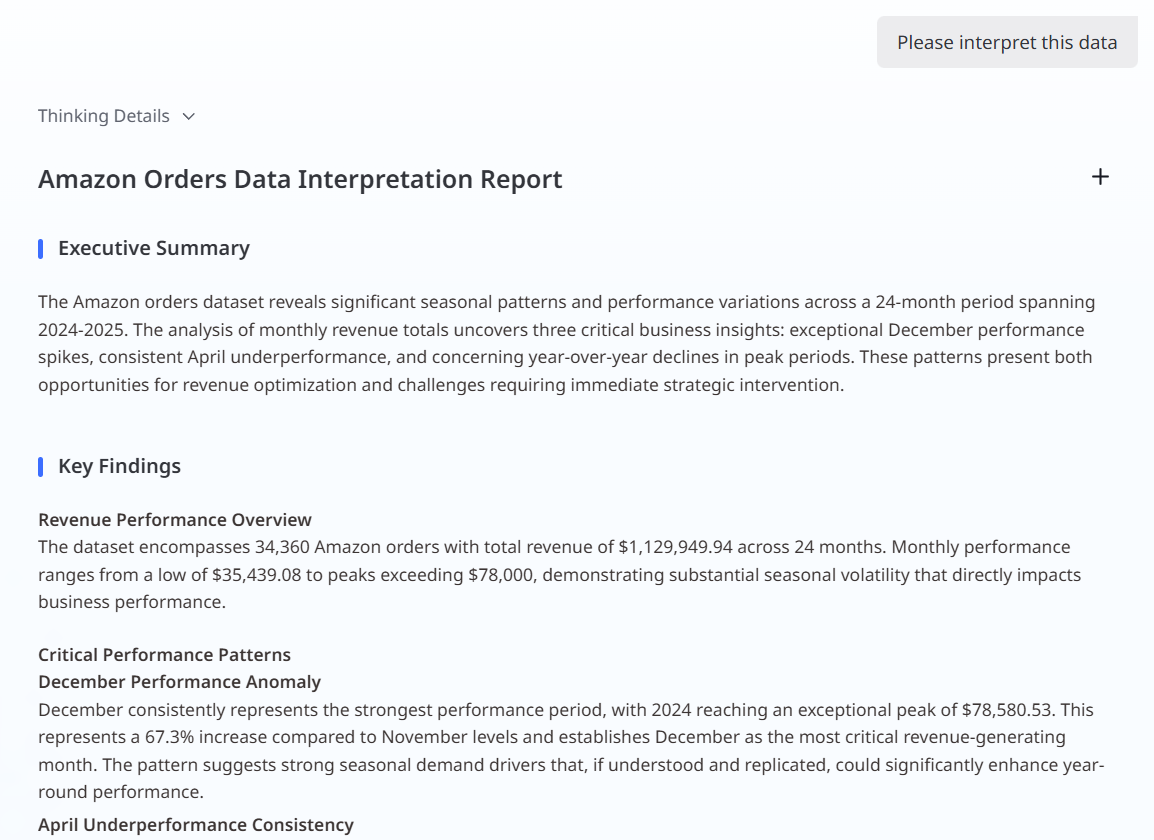
Analyze complex datasets in depth to identify key trends, patterns, and anomalies. Describe what you need or click the Interpretation button below a result to get a structured insight summary.
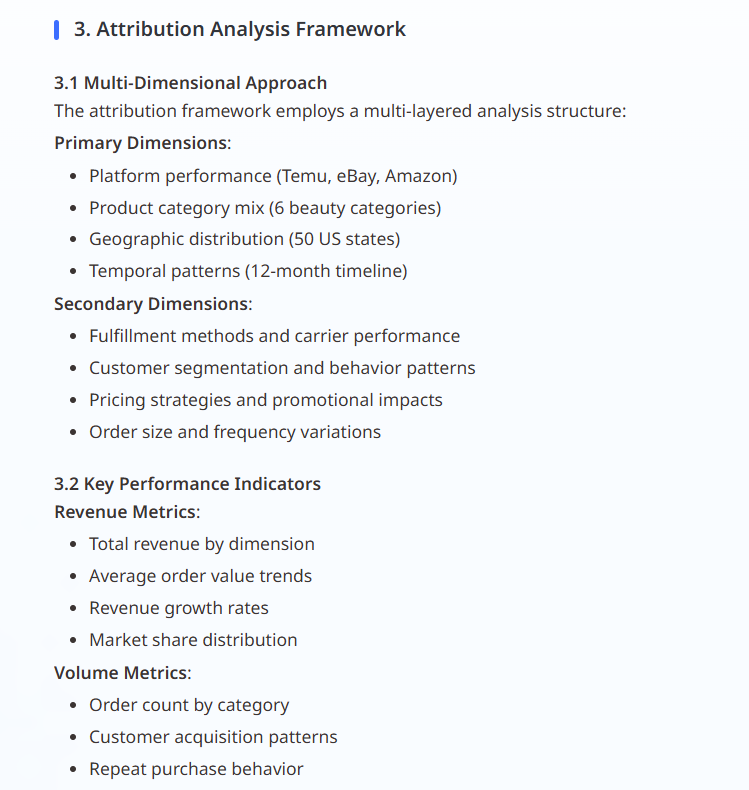
Attribution Analysis
Click Advanced Analysis below any chart to explore what's driving a change. The system decomposes the fluctuation across dimensions, quantifies each contribution, and points out the primary drivers (e.g. locating key factors from the GMV formula structure).
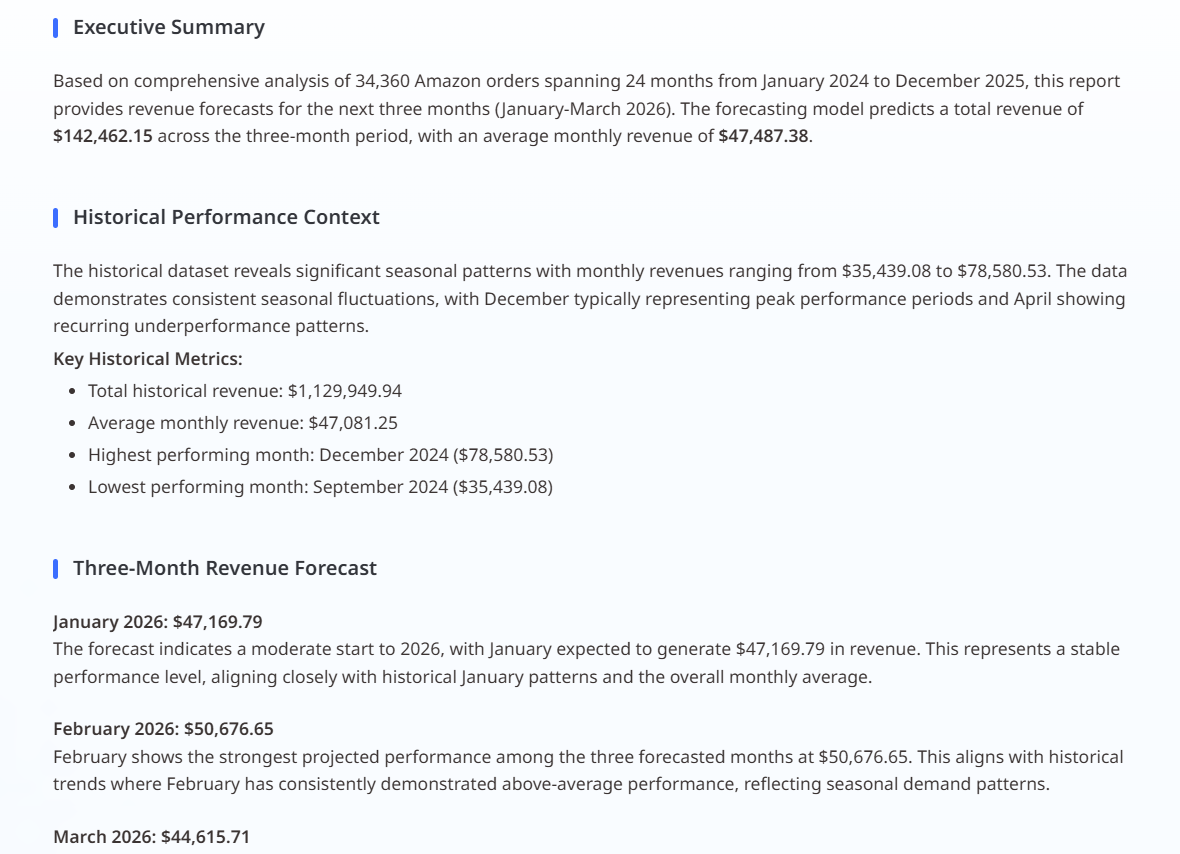
Trend Prediction
Click the Prediction button at the bottom-left of a chart to extend a time series into the future. The system analyzes historical patterns to generate forward-looking forecasts, helping you anticipate change and plan ahead.
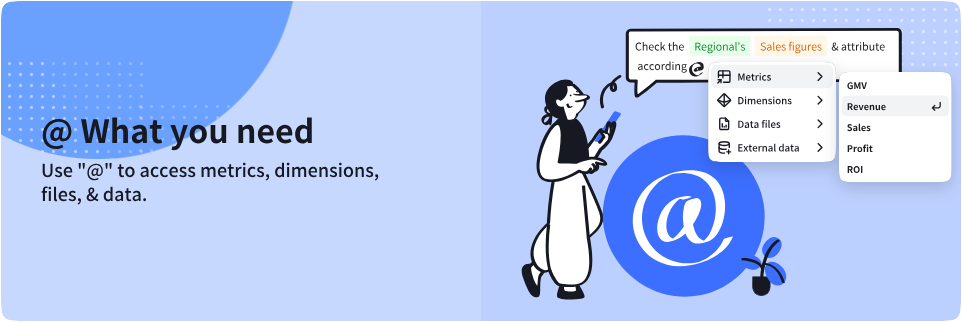
@ Everything You Need
Instantly call up anything through the intuitive "@ What You Need" system:
- Metrics & dimensions: KPIs like GMV, revenue, sales volume, profit, ROI
- Data files & external data: seamlessly plug into your data ecosystem
- Smart suggestions: context-aware recommendations
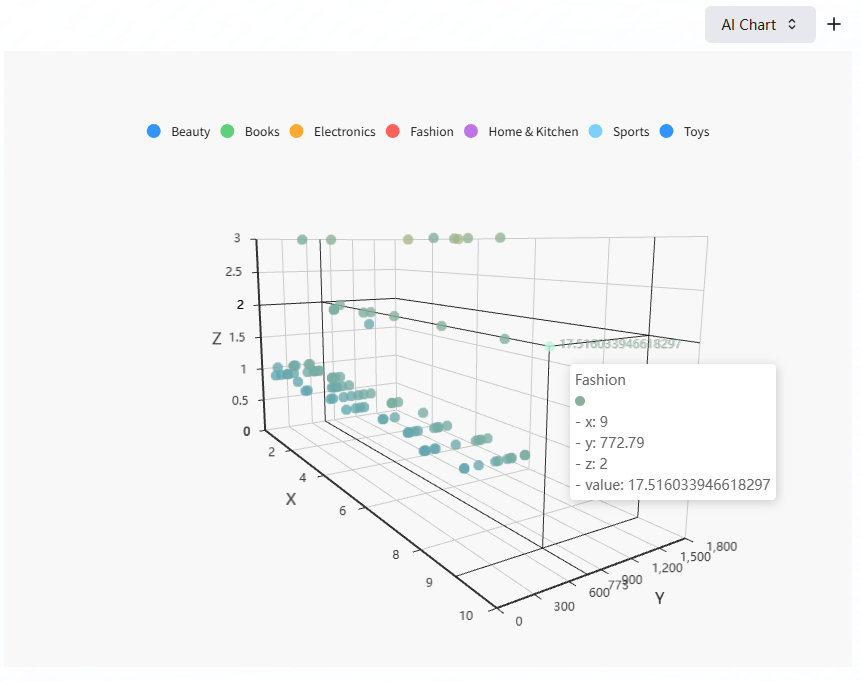
Charts & Visualizations
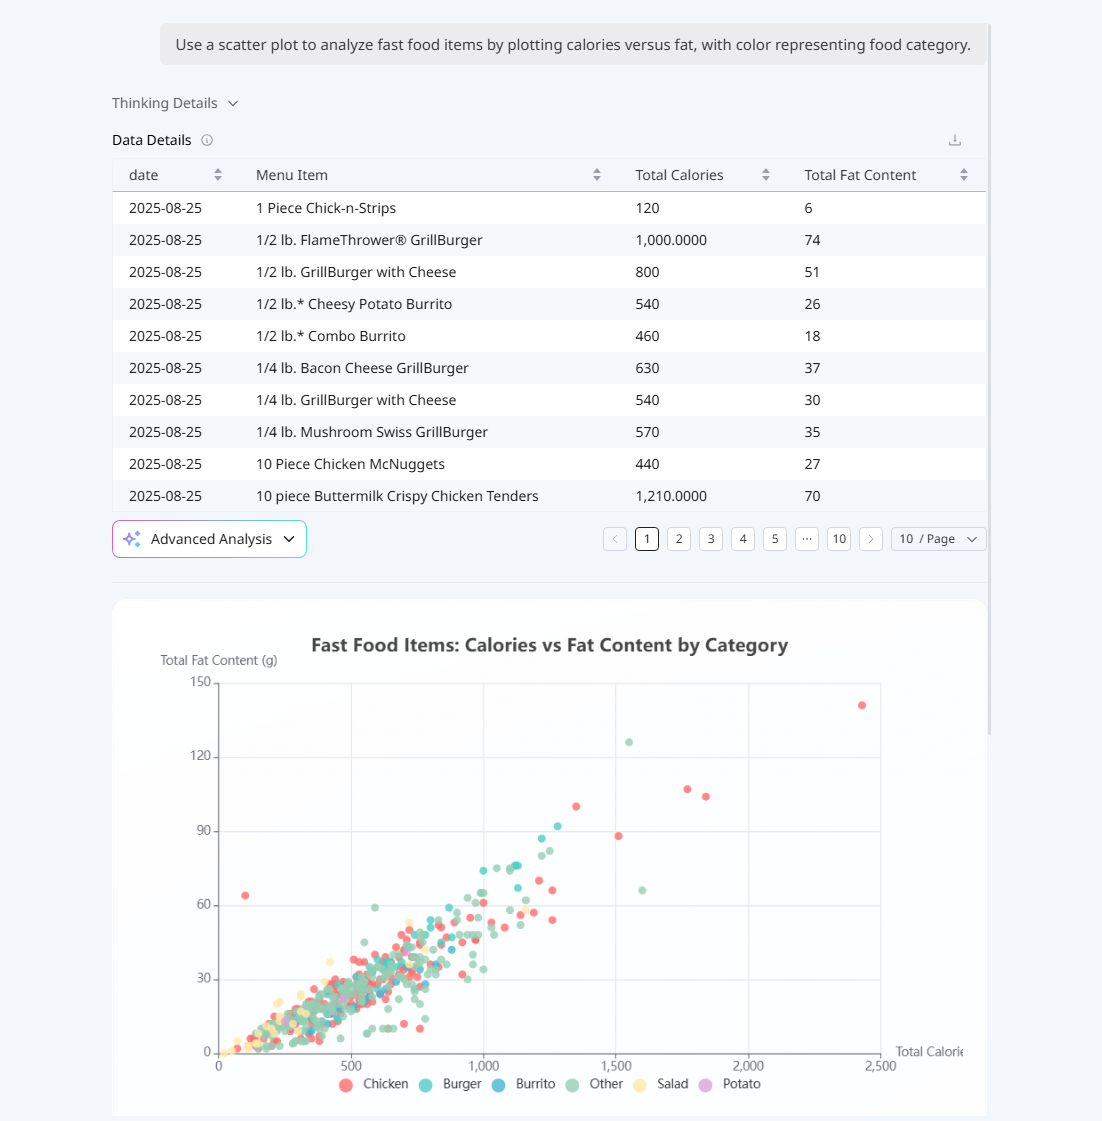
Turn query results into clear, intuitive charts to quickly spot trends, anomalies, and cross-dimension comparisons. Specify a chart type in your prompt or let the system choose. Within the same chat you can adjust metrics, filters, grouping, chart type, colors, and style anytime — each change regenerates the chart.
Dashboard
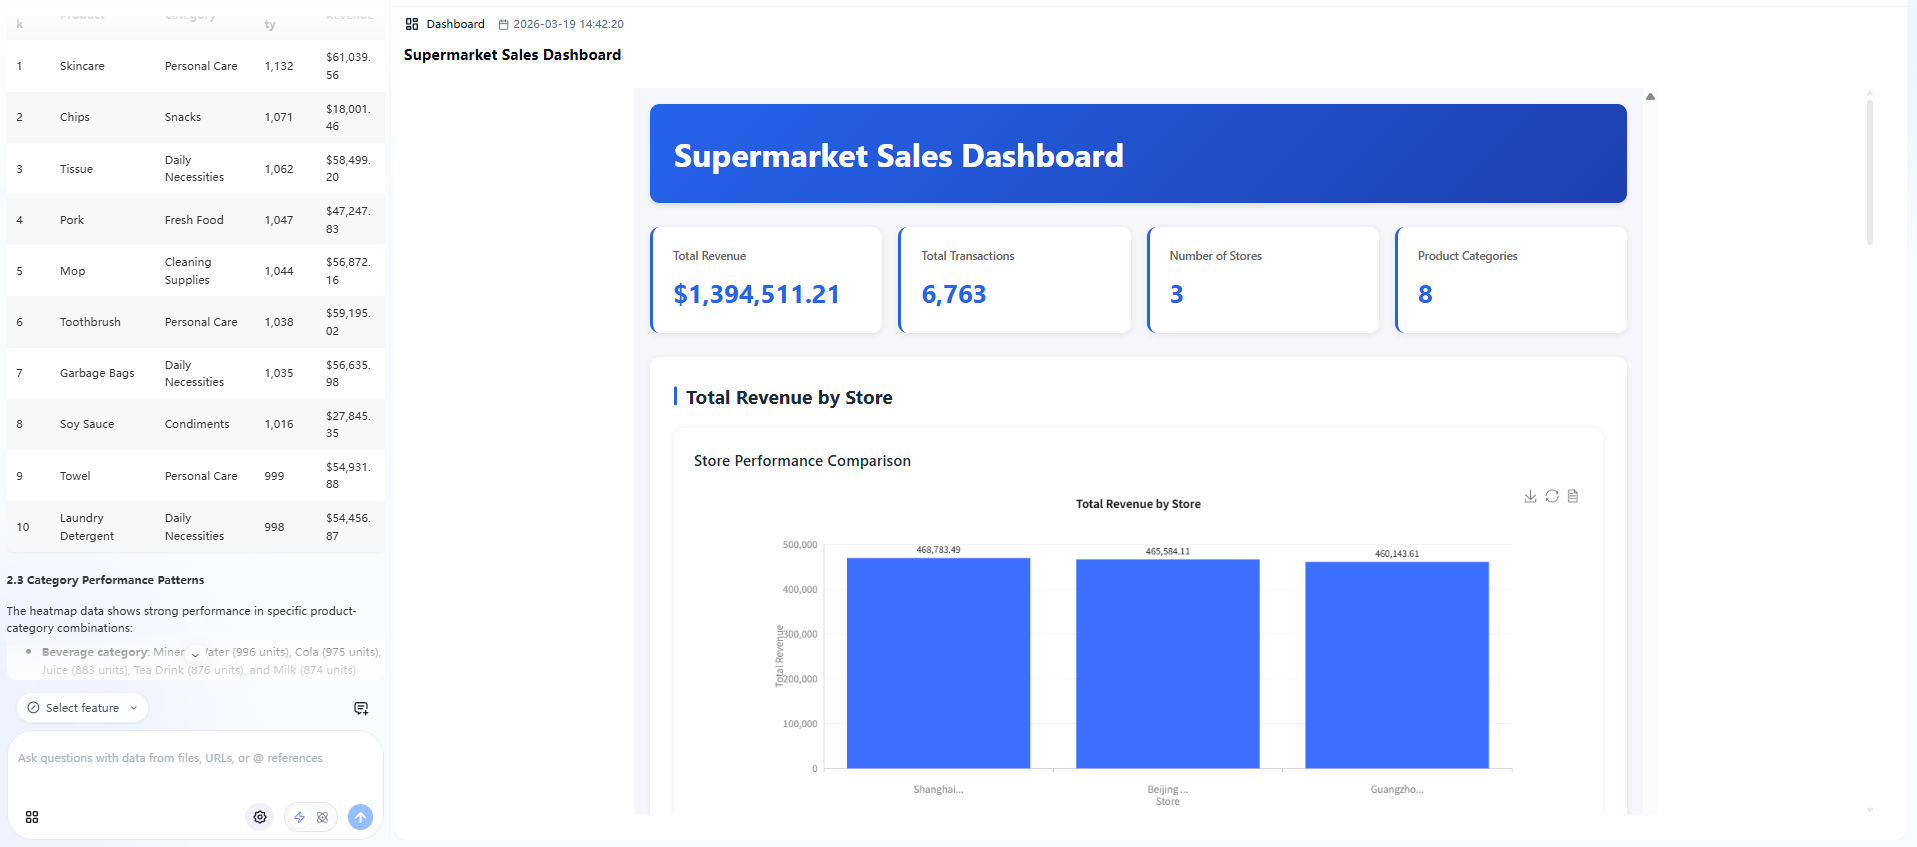
Use the Build Dashboard shortcut in chat and the system arranges related charts, tables, and summaries into a structured layout. Colors adapt to the query context, and key conclusions are surfaced as annotations. Multiple projects can switch via themed tabs, and every component is individually downloadable.
Deep Report
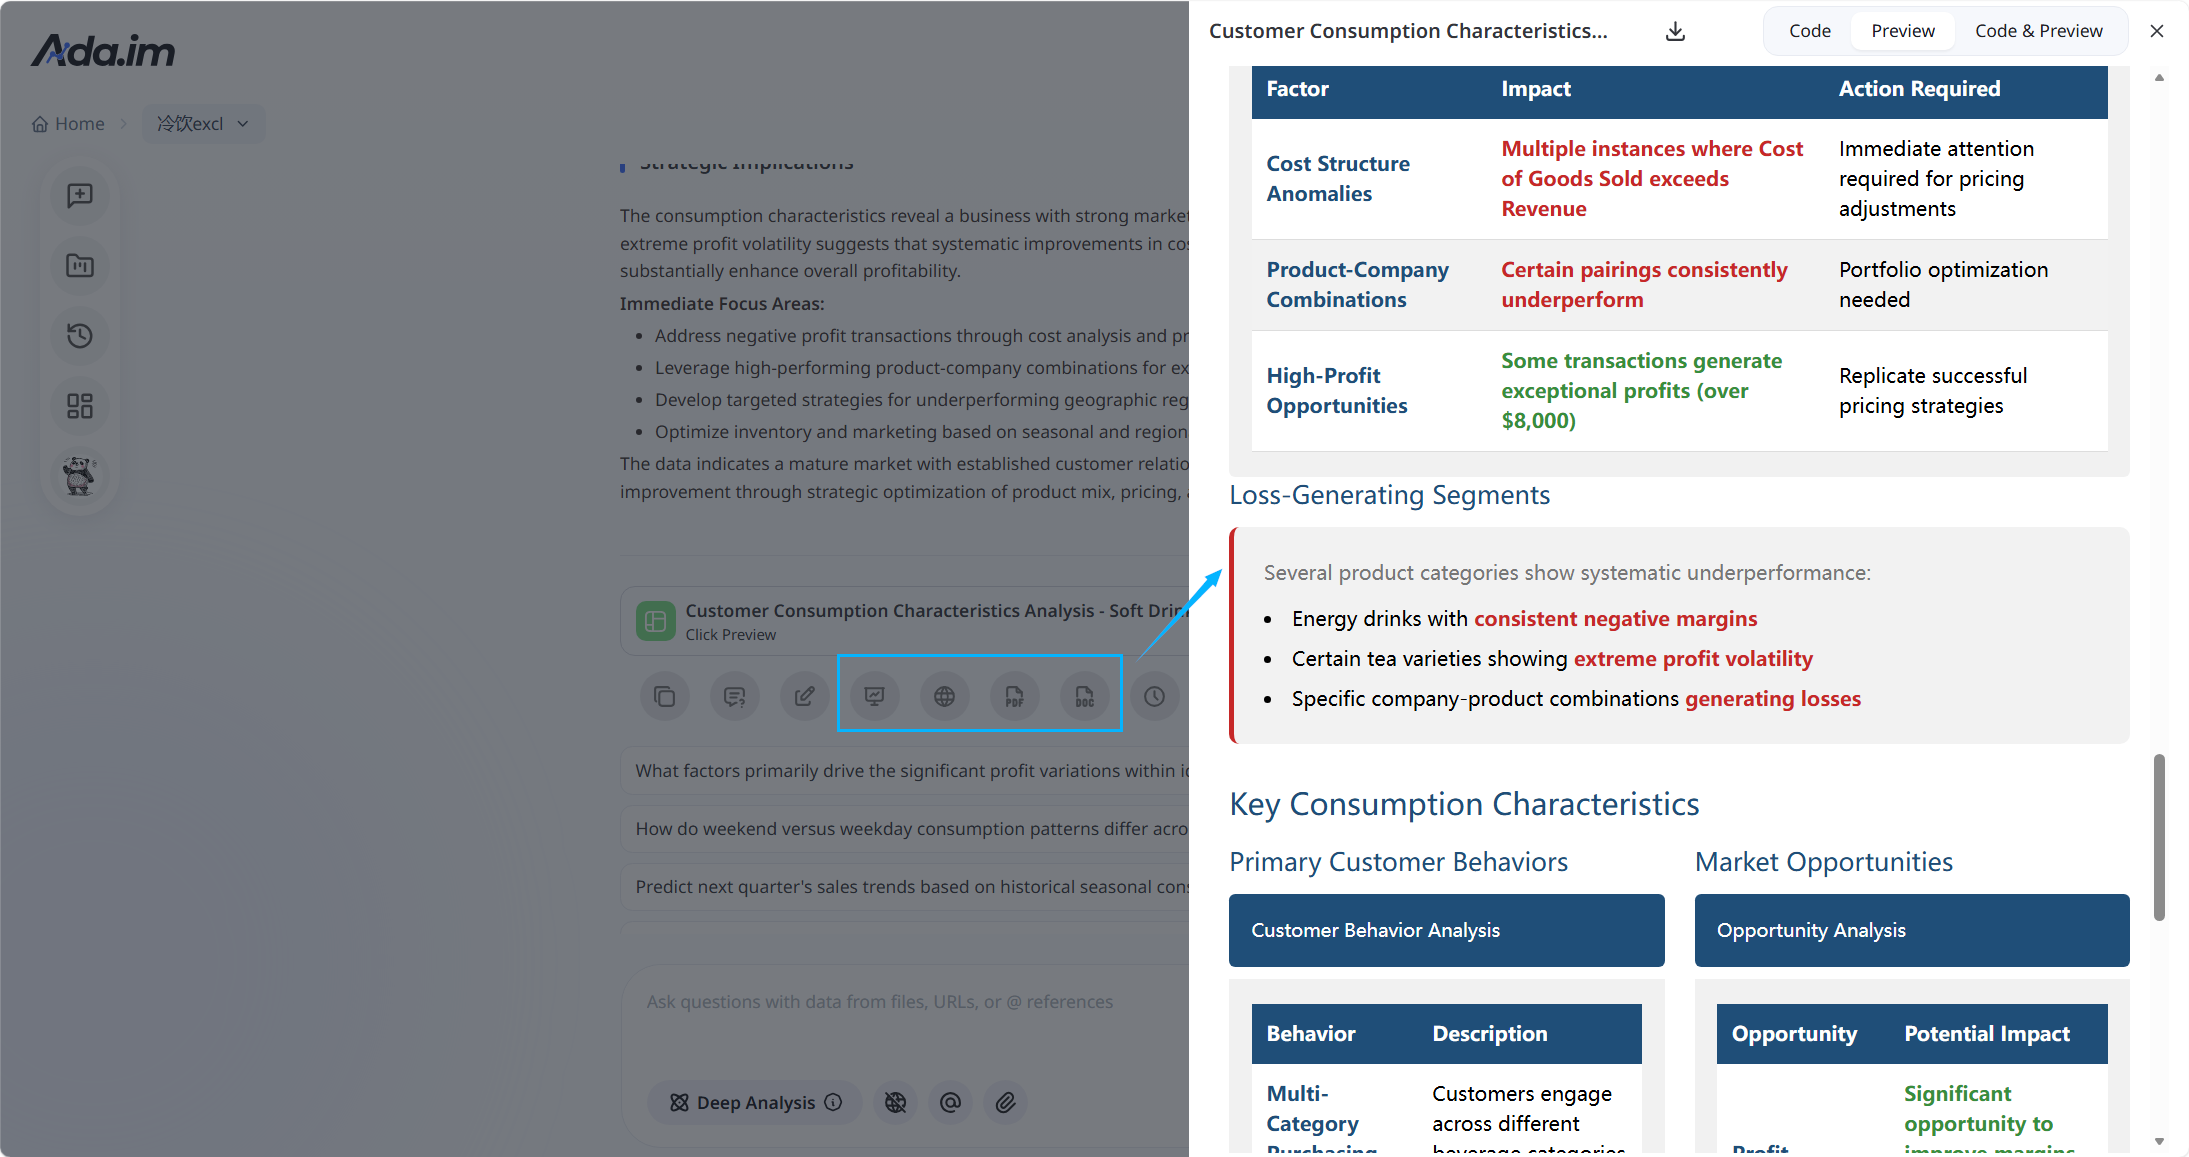
On the home page click Write report and submit a natural-language request to trigger full report generation. The system runs long-chain reasoning, usually producing a professional report with charts, tables, and insights in 5–15 minutes. It generates Markdown first, then export via the bottom buttons:
- HTML / PPT: enhanced visual layout based on content and needs
- Word / PDF: direct download of the Markdown content, ideal for archiving and sharing
Presentation (PPT)
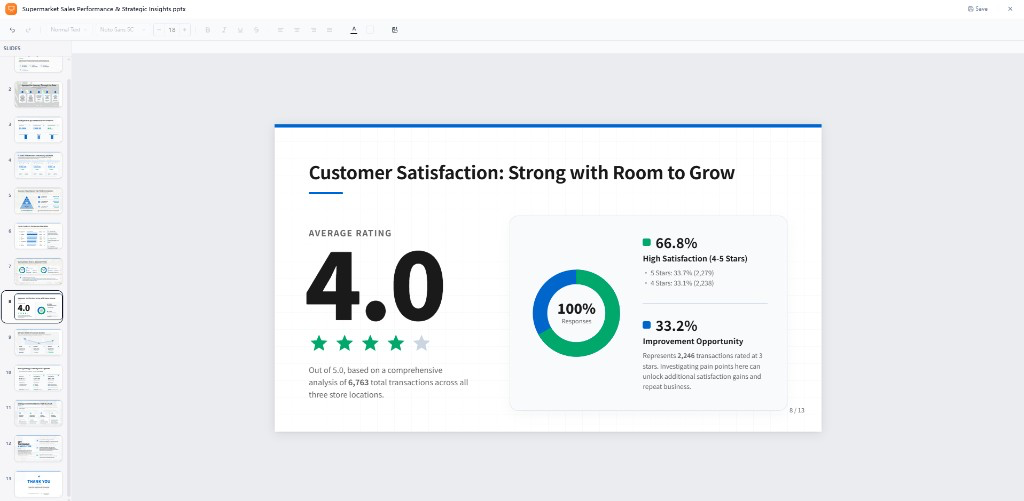
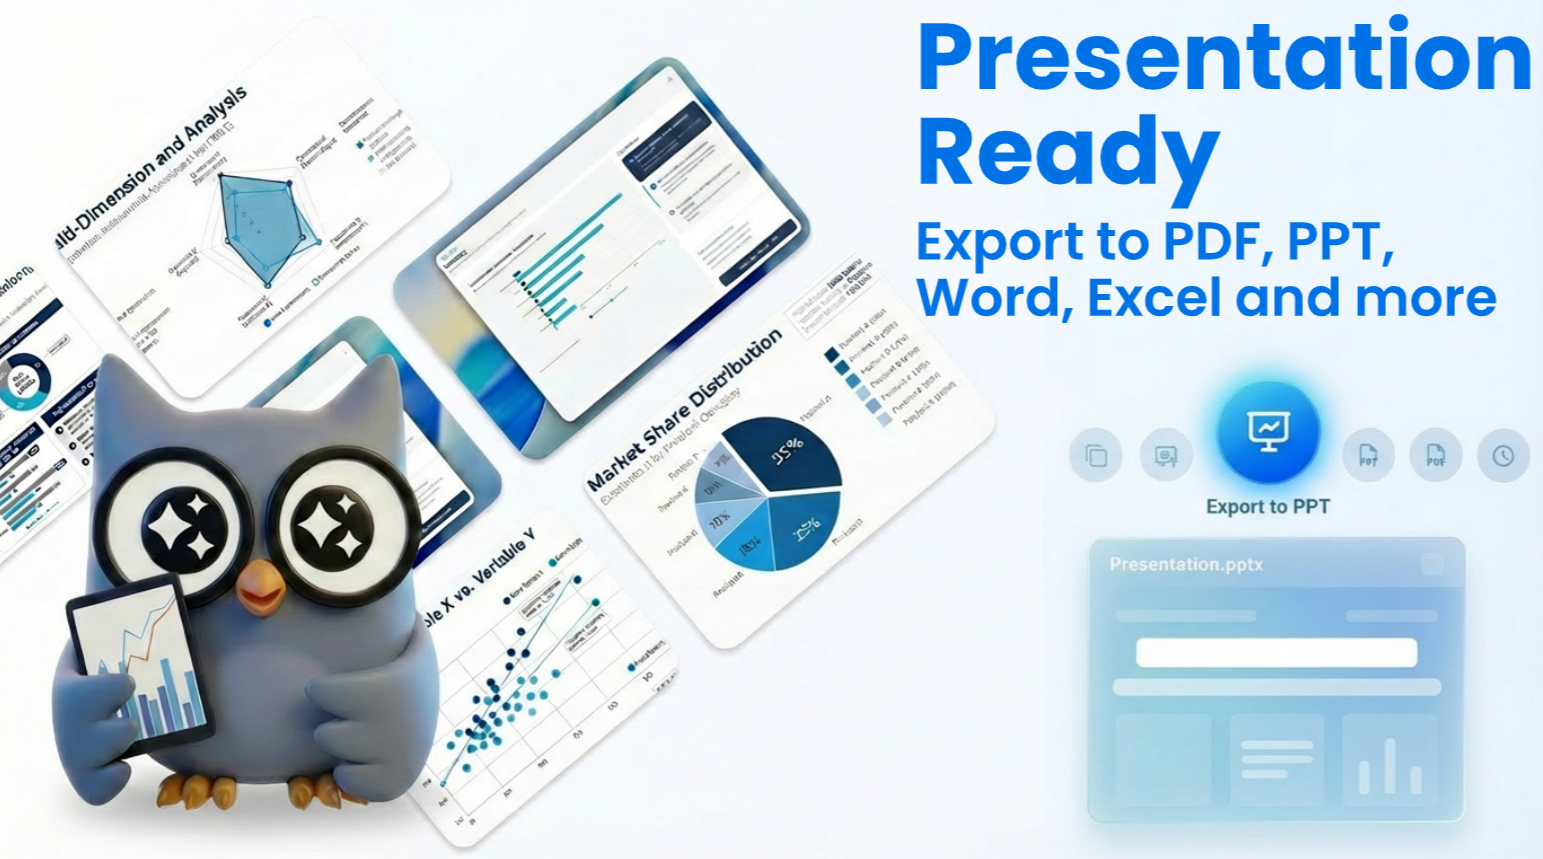
Not just charts stacked together — the system builds a coherent business narrative, integrating a data overview, deep insights, action recommendations, and a closing. The built-in presentation editor lets you edit text and layout directly, then export a standard .pptx.
Data Extraction
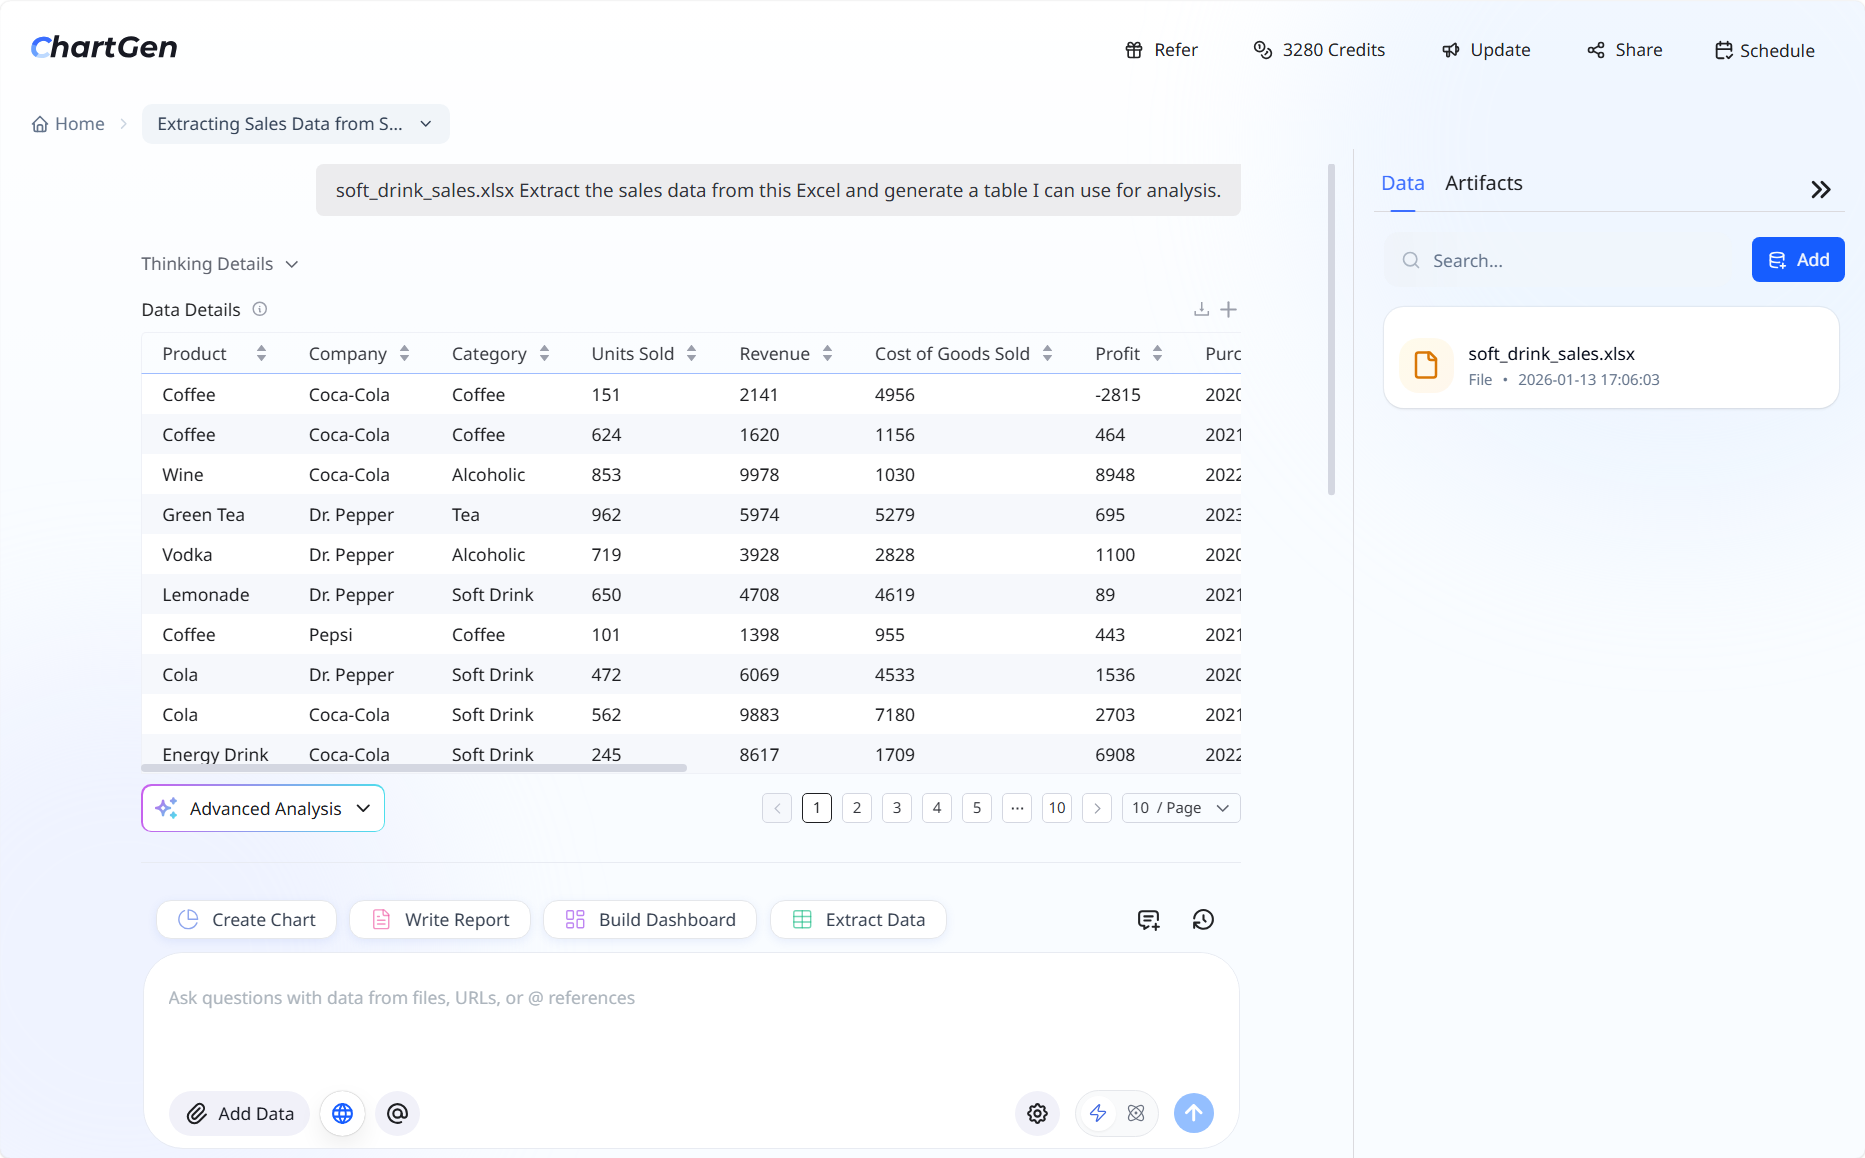
Generate new structured tables from existing data. Describe the columns or metrics you need and the system derives them from your dataset, output as a downloadable table.
- Add derived columns (e.g. profit margin from revenue and cost)
- Build new features for downstream analysis (customer tiers, retention windows)
- Reshape or aggregate a dataset into a new table form
Artifact Management
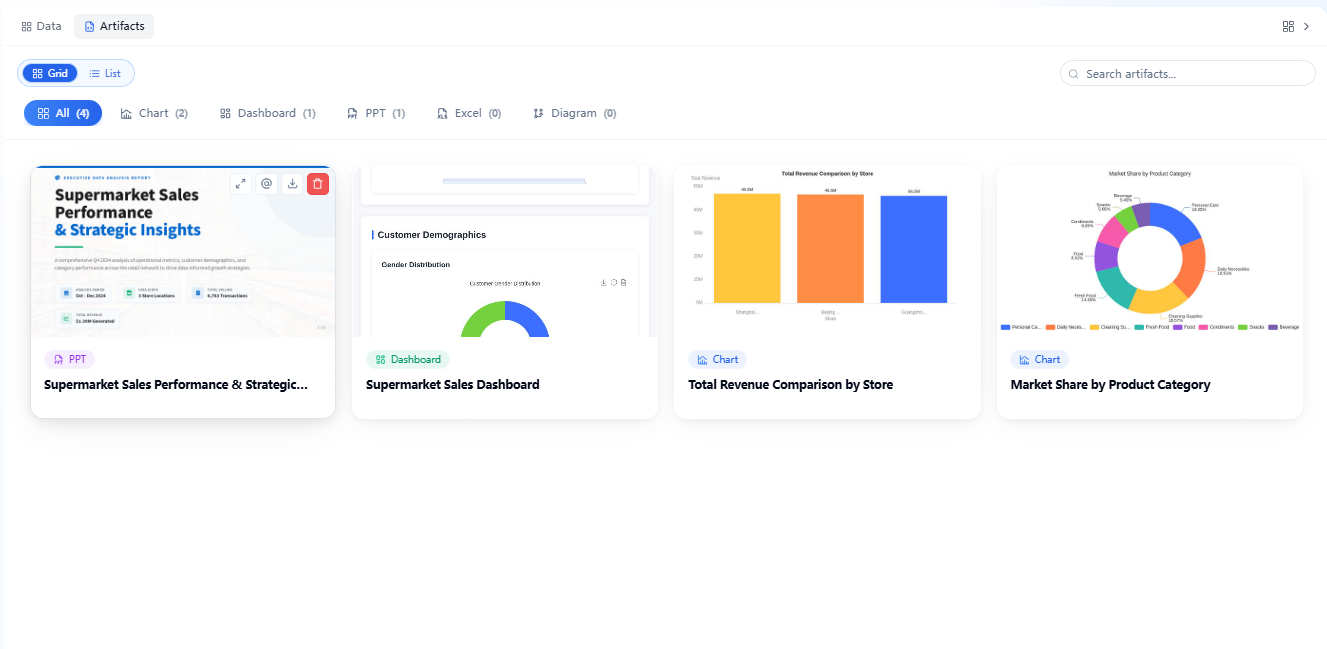
The Artifacts panel centrally manages all AI-generated artifacts, auto-saved and archived. Switch between grid/list, filter by category, and search by keyword. Each card supports full-screen viewing, @-referencing to continue analysis, download, or delete; click any artifact to return to its original chat context.
AI Edit & Diagram
AI Edit is built into the main chat flow and works for charts, tables, dashboards, diagrams, reports, and PPTs — no separate edit mode. Just say what to change in the chat, or @ an artifact and describe the edit. Every edit is tracked and you can switch between history versions anytime (available on the free plan too). Diagram: mind maps, flowcharts, class diagrams, and more — all generated from one sentence and managed in the Artifacts panel like any other artifact.
One-Click Sharing
Any artifact — chart, table, dashboard, or report — can be shared securely in one click. Share the whole conversation (prompts, reasoning, and all artifacts) or just the final artifact. Click Share in the top-right to generate a link, or quickly distribute to X, LinkedIn, Facebook, and Reddit.
Projects: Long-Term Analysis
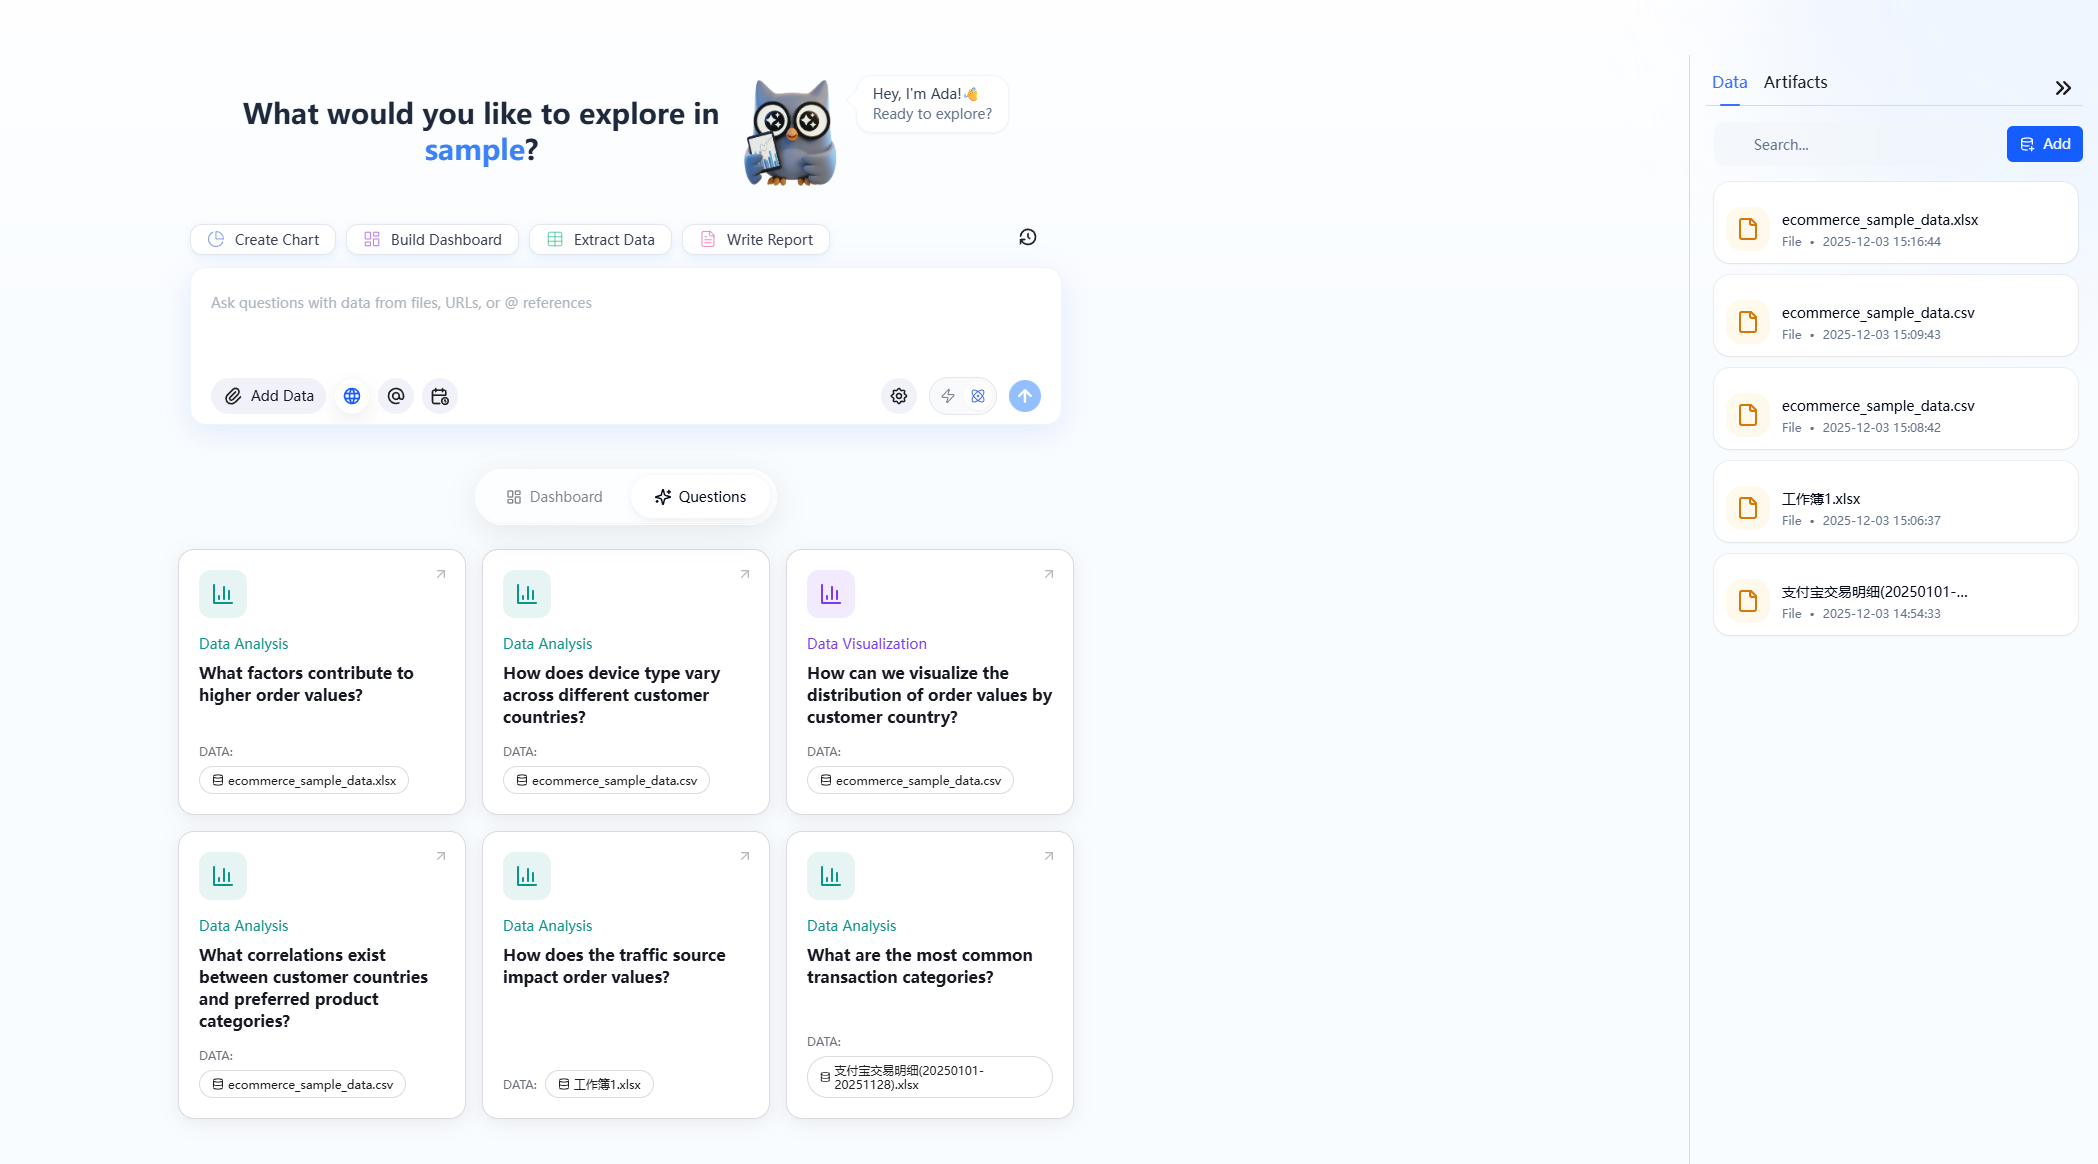
Projects are the core unit ChartGen AI uses for long-term analysis. They centralize data, context, and analysis so you don't re-explain the background each time. A project contains:
- Your private data and the artifacts produced in chats
- AI dashboards for long-term monitoring
- Instructions, scheduled tasks, and project memory
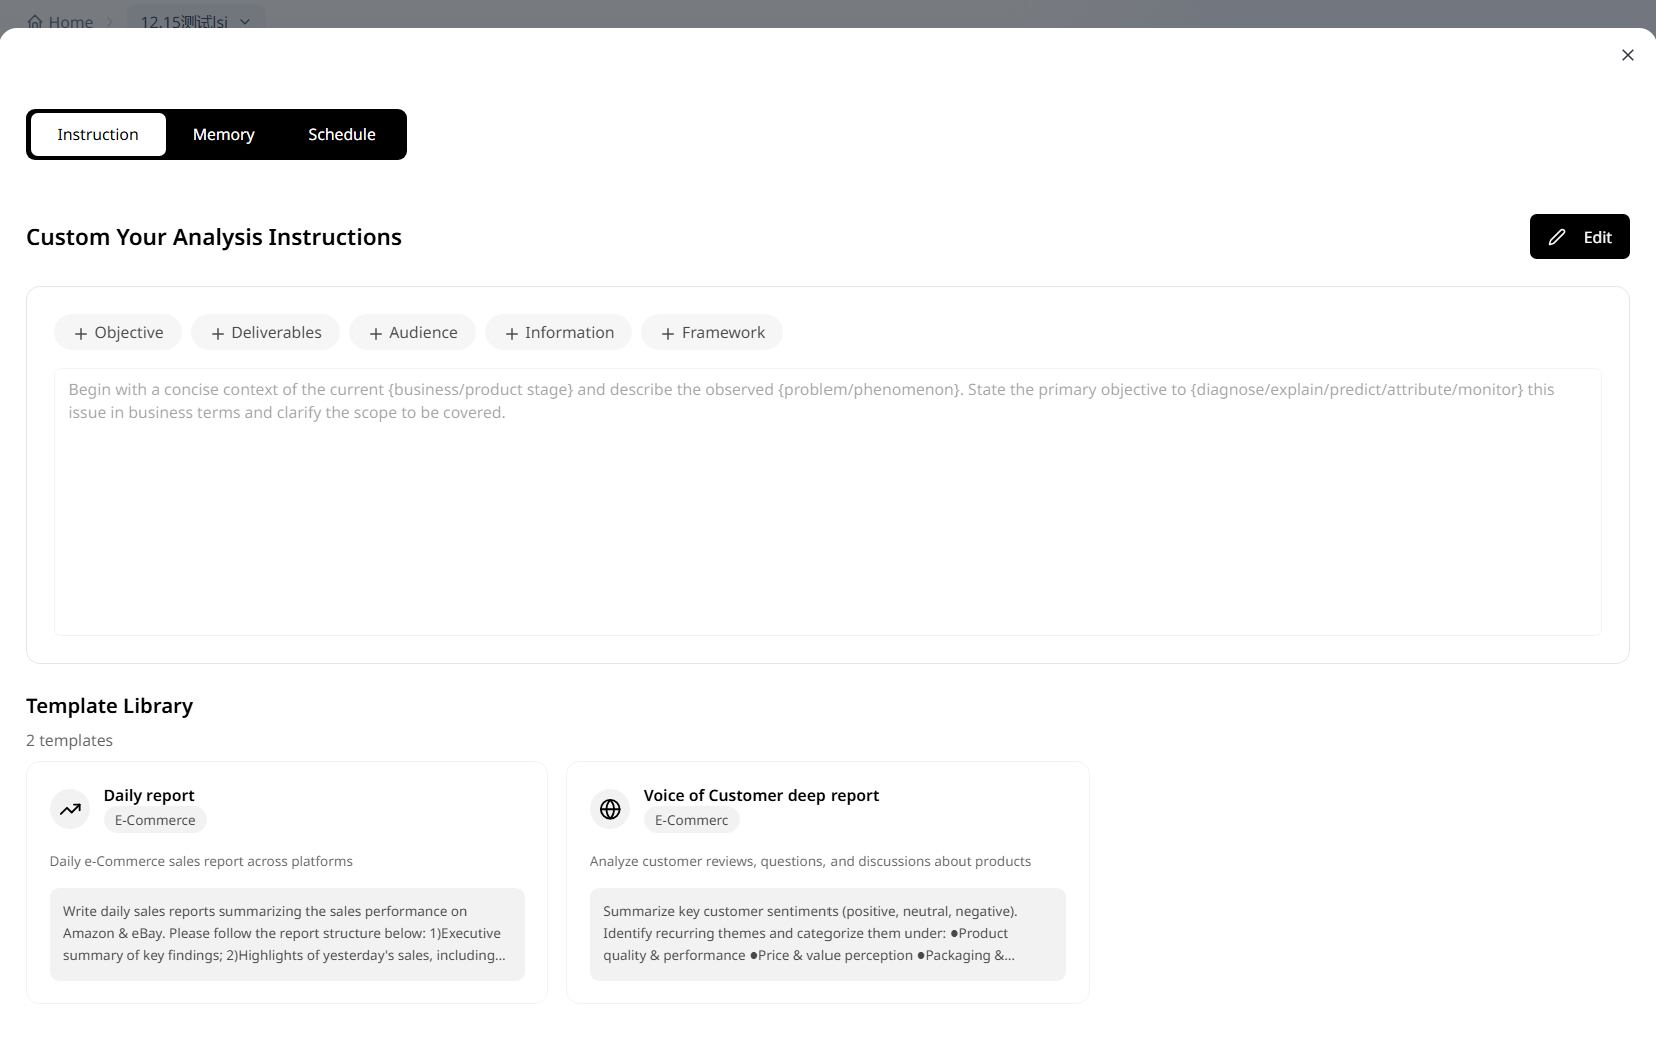
Instructions
Instructions describe the current project's context and analysis expectations, helping the system understand your preferences and output format. Edit them anytime in project settings at the bottom-right of the chat window. You can specify audience, business context, specific analysis requirements, output format, and tone. Note: project instructions apply to every chat.
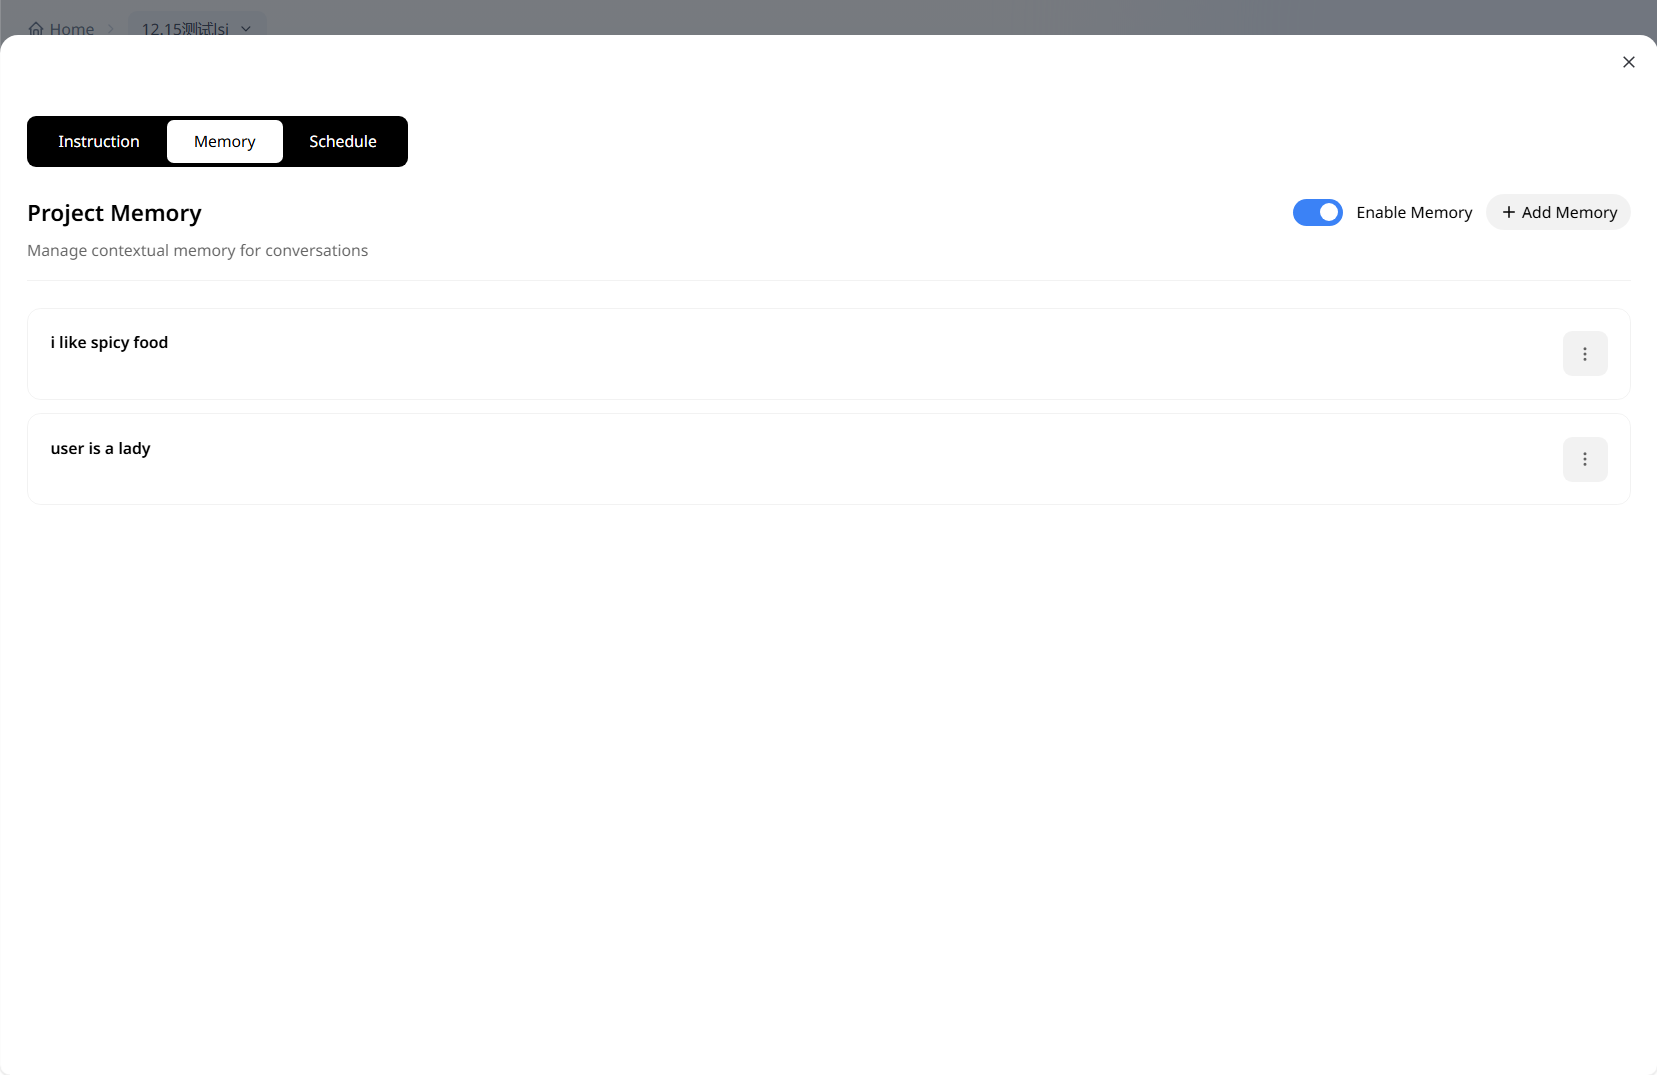
Project Memory
Record confirmed key information within a project — stable business needs, common metrics, key definitions, or analysis preferences — so you don't repeat yourself in later chats. Create, view, and manage it in project settings, or just tell the system to "remember" something in a chat. Best for stable long-term preferences, not one-off information.
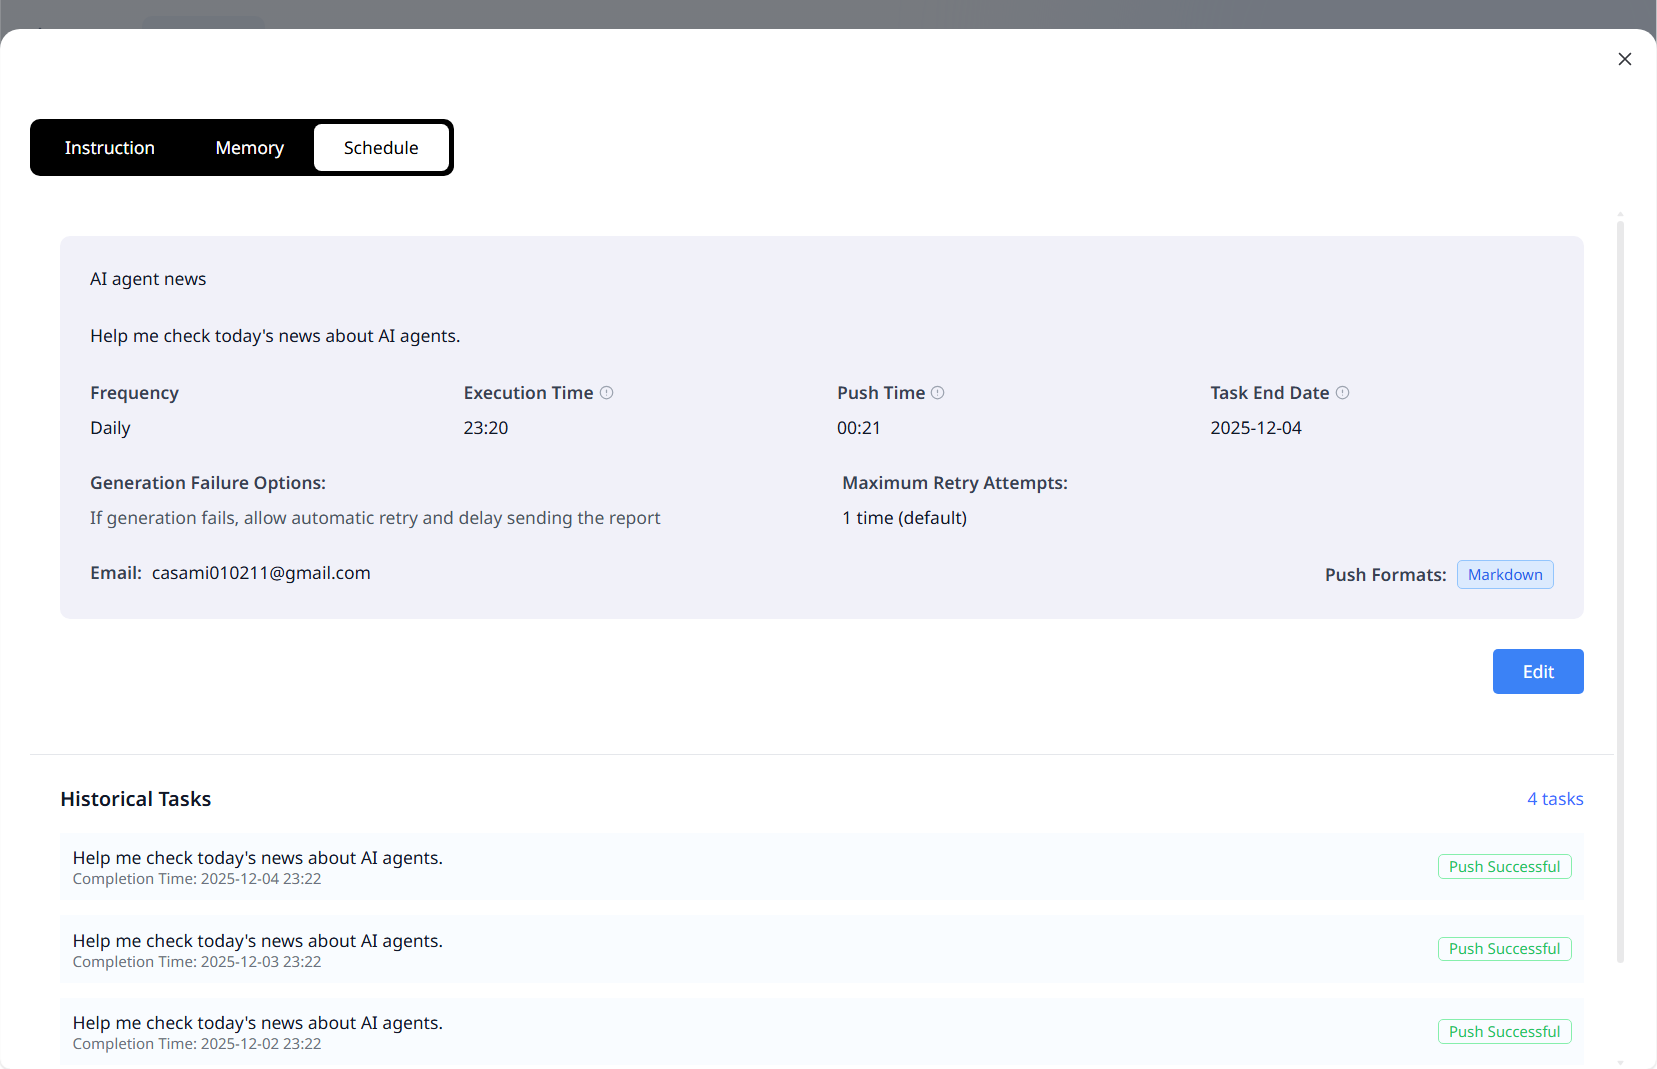
Scheduled Tasks & Automation
Click the schedule button at the bottom-left of the chat window to set the run time, delivery method, and recipient email. Then describe the task to run on schedule in chat, and the system will auto-analyze and send the report on time. Check status in the top-right of the project, and pause or delete anytime.
Data Workbench
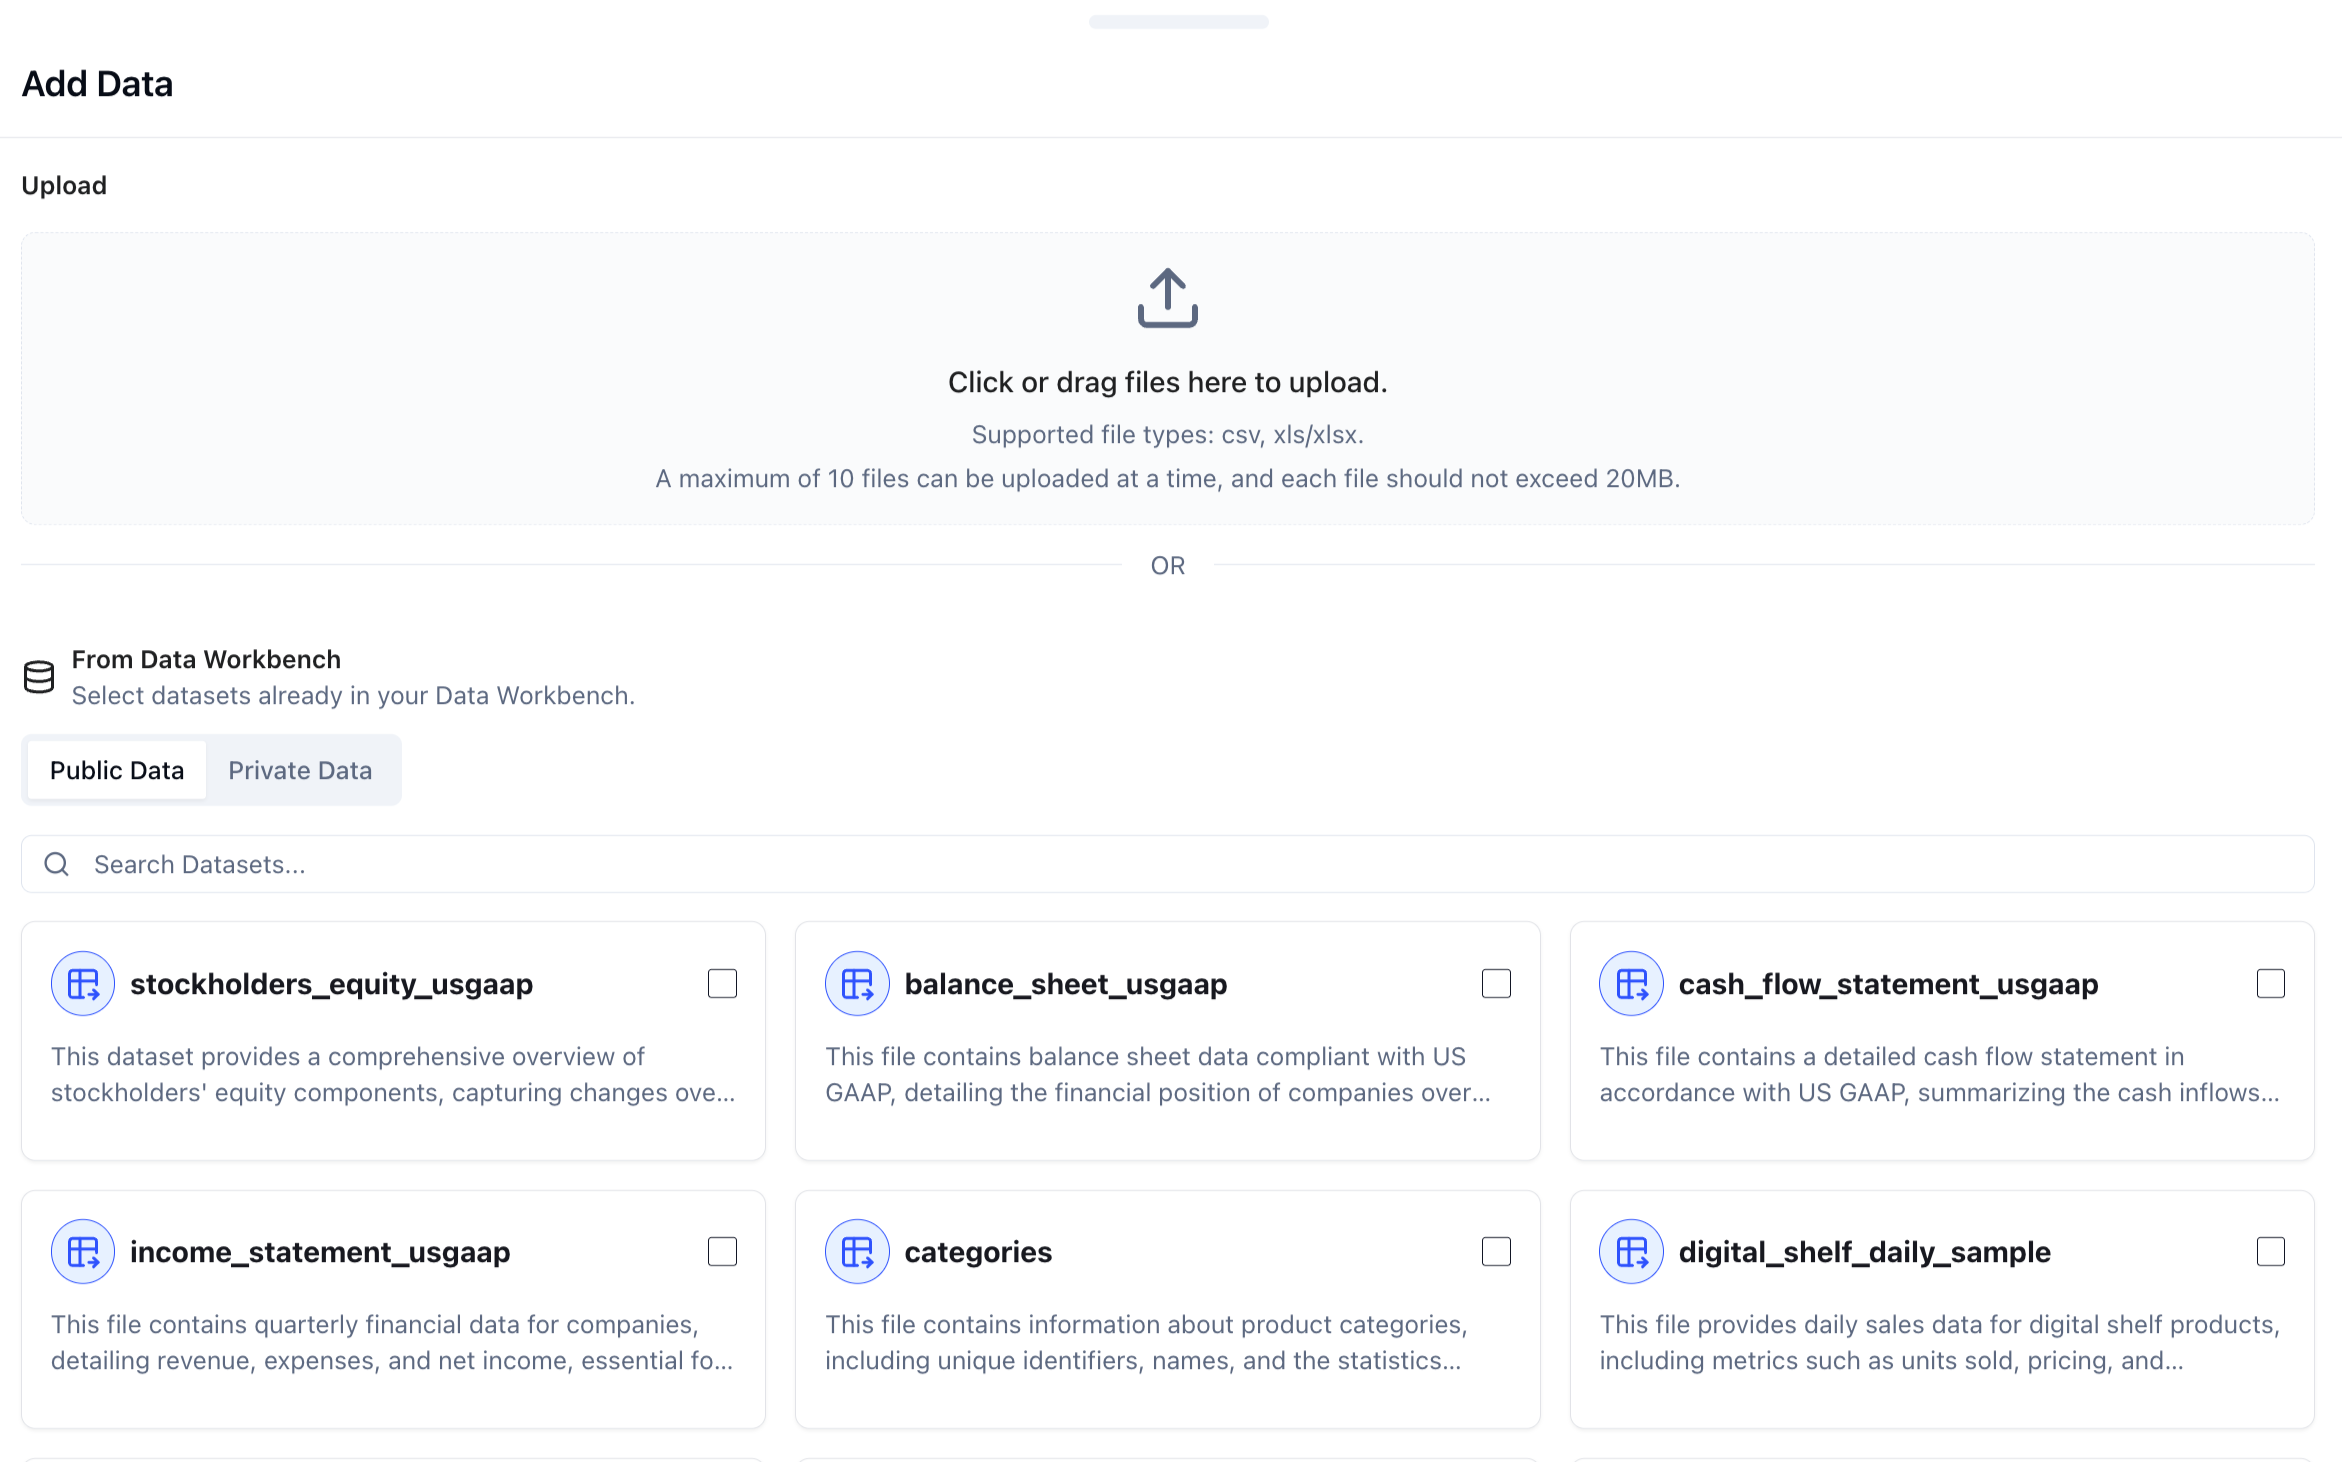
Manage all the data ChartGen AI uses to answer questions: ready-to-use public datasets, plus secure management of your private data sources.
Public Data
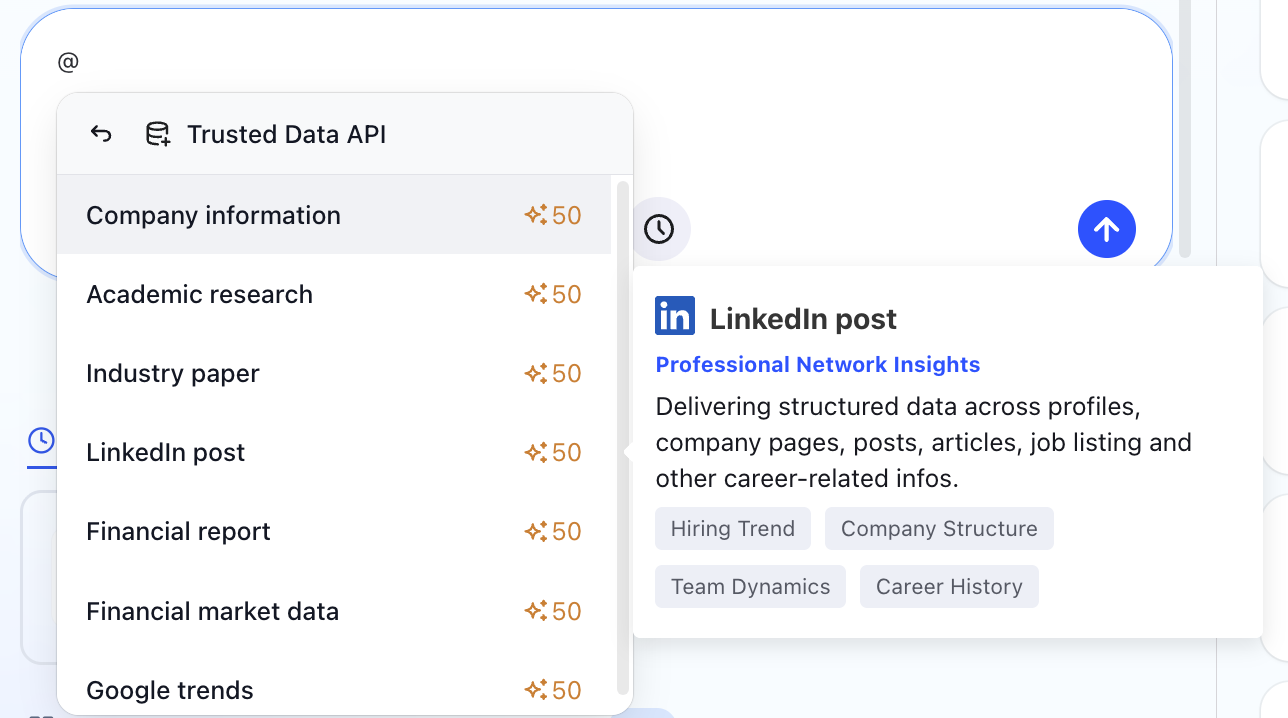
Curated high-quality datasets and pre-configured APIs you can use directly in ChartGen AI. Data is pre-processed and needs no cleaning; APIs pull live external data in one click. Ideal for blended analysis — comparing your internal private data against external benchmarks or live market data.
Private Data
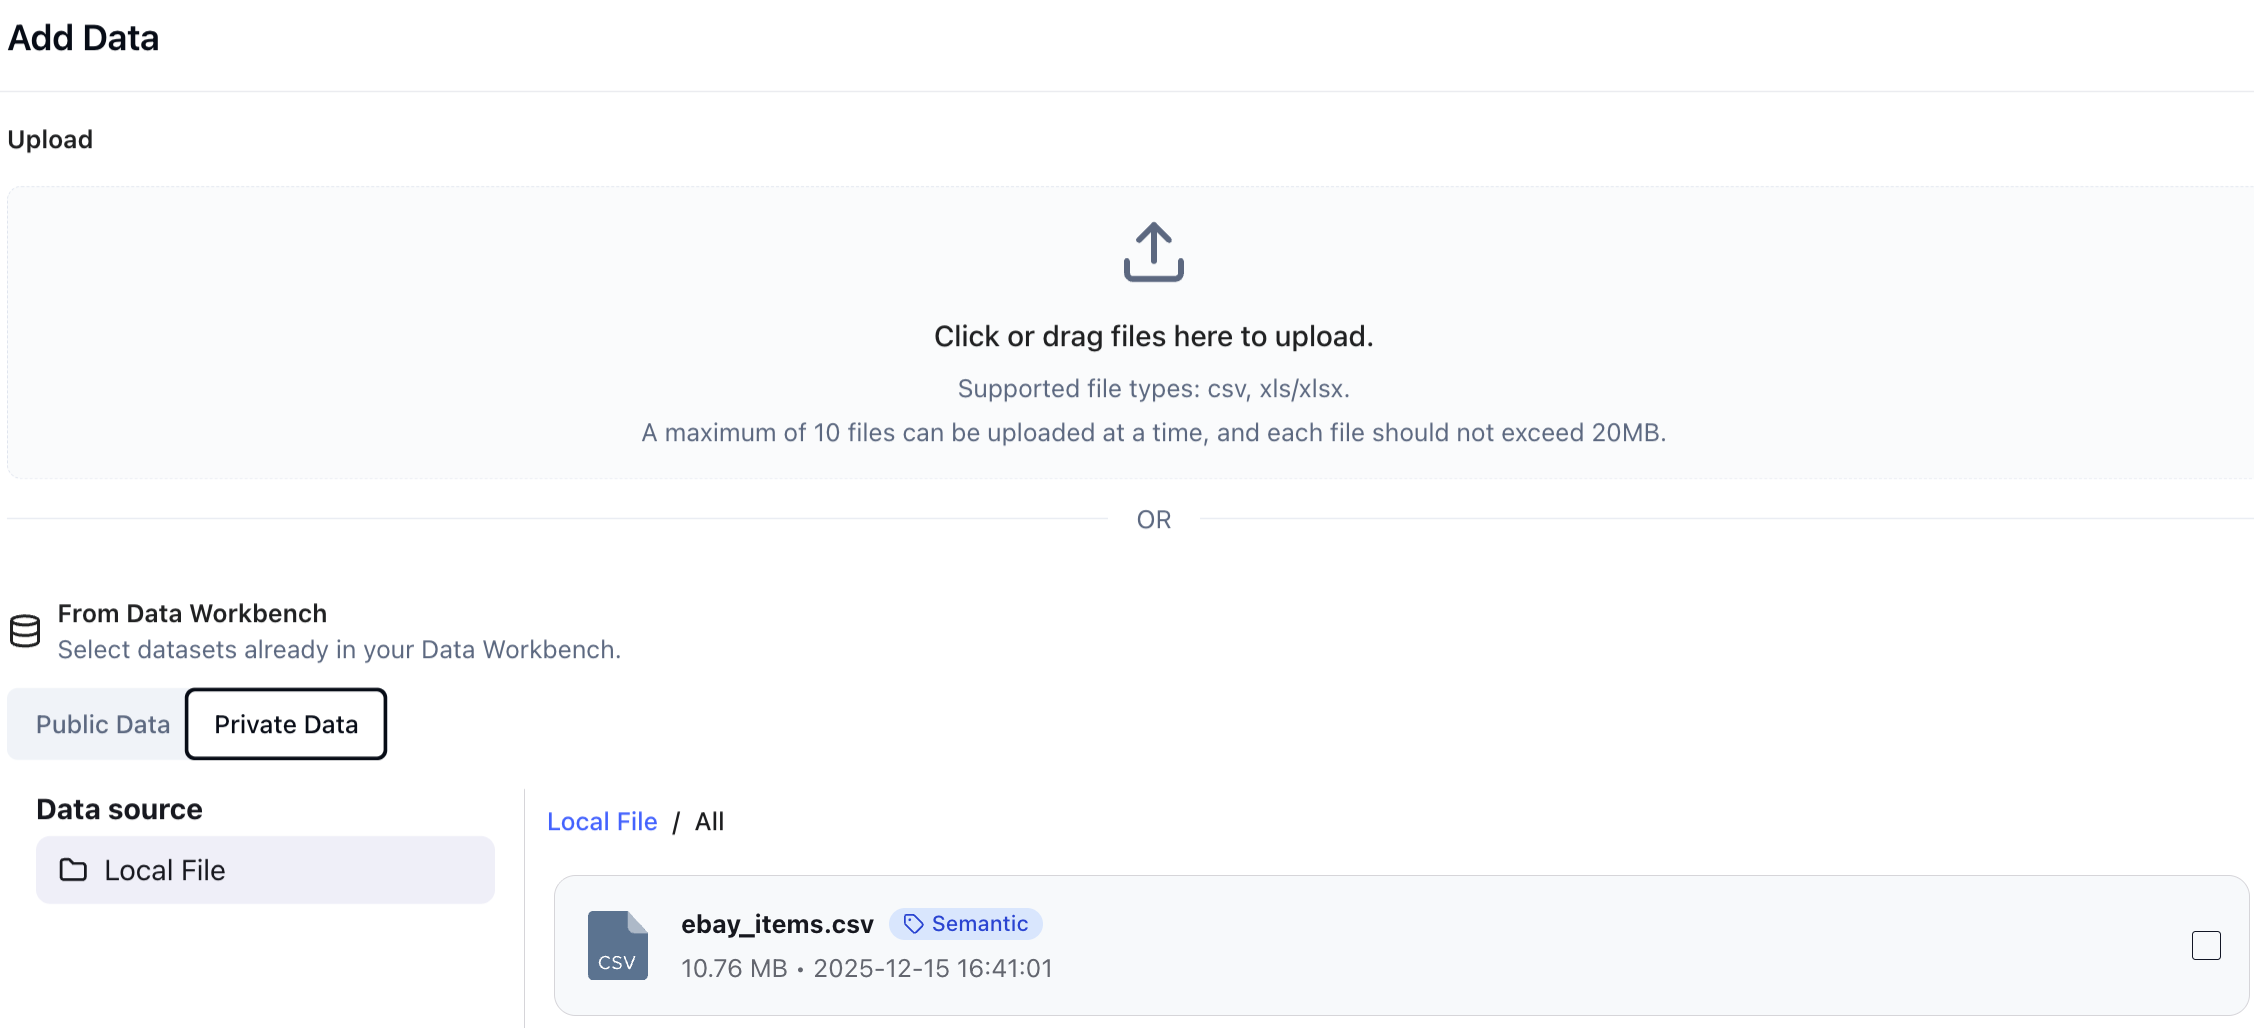
Manage your own organization's data, imported two ways: Two processing modes: Data Analysis reads the file content directly (good for structured data and full documents); Data Extraction extracts tables first, then analyzes (good for complex PDFs/Word with mixed text and graphics).
- File upload: supports .csv / .xls / .xlsx / .pdf / .docx / .md; up to 10 files at once, each ≤ 100MB.
- Live connections: QuickBooks, NetSuite, Stripe, eBay, plus MySQL, PostgreSQL, SQL Server, Snowflake, Azure SQL, and more.
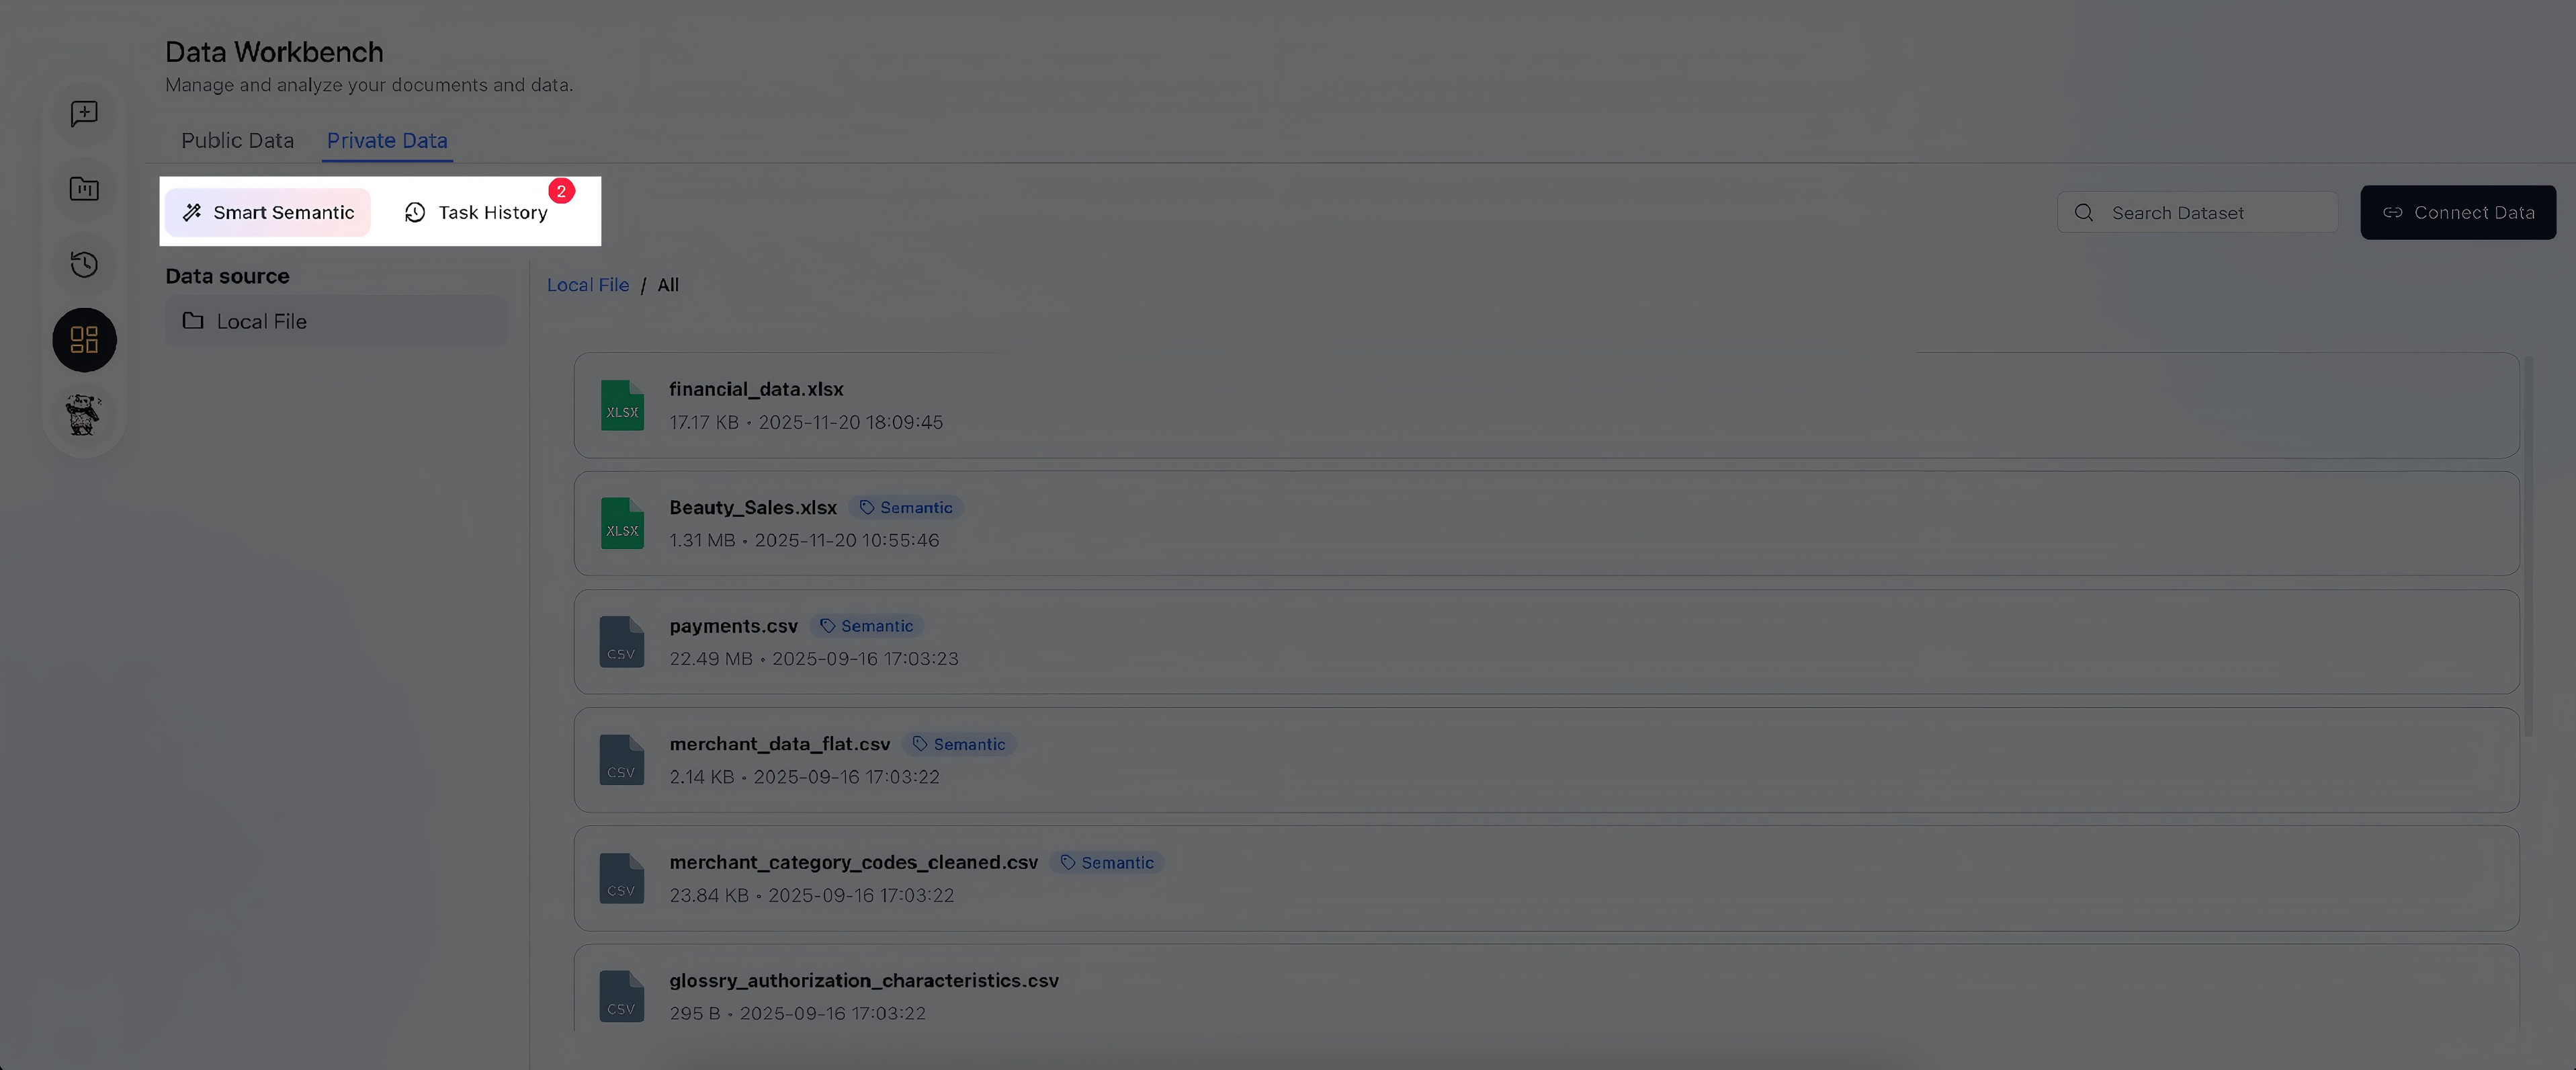
Smart Semantic
Uploading tables alone isn't enough for deep reasoning. The Smart Semantic engine scans raw data, identifies logical relationships, and auto-defines: metrics (e.g. revenue, churn rate), dimensions (e.g. region, category, time), and table relationships. It significantly reduces hallucination, improves stability, and unlocks complex capabilities like attribution. Processed data carries a "Semantic" tag.
Web Search
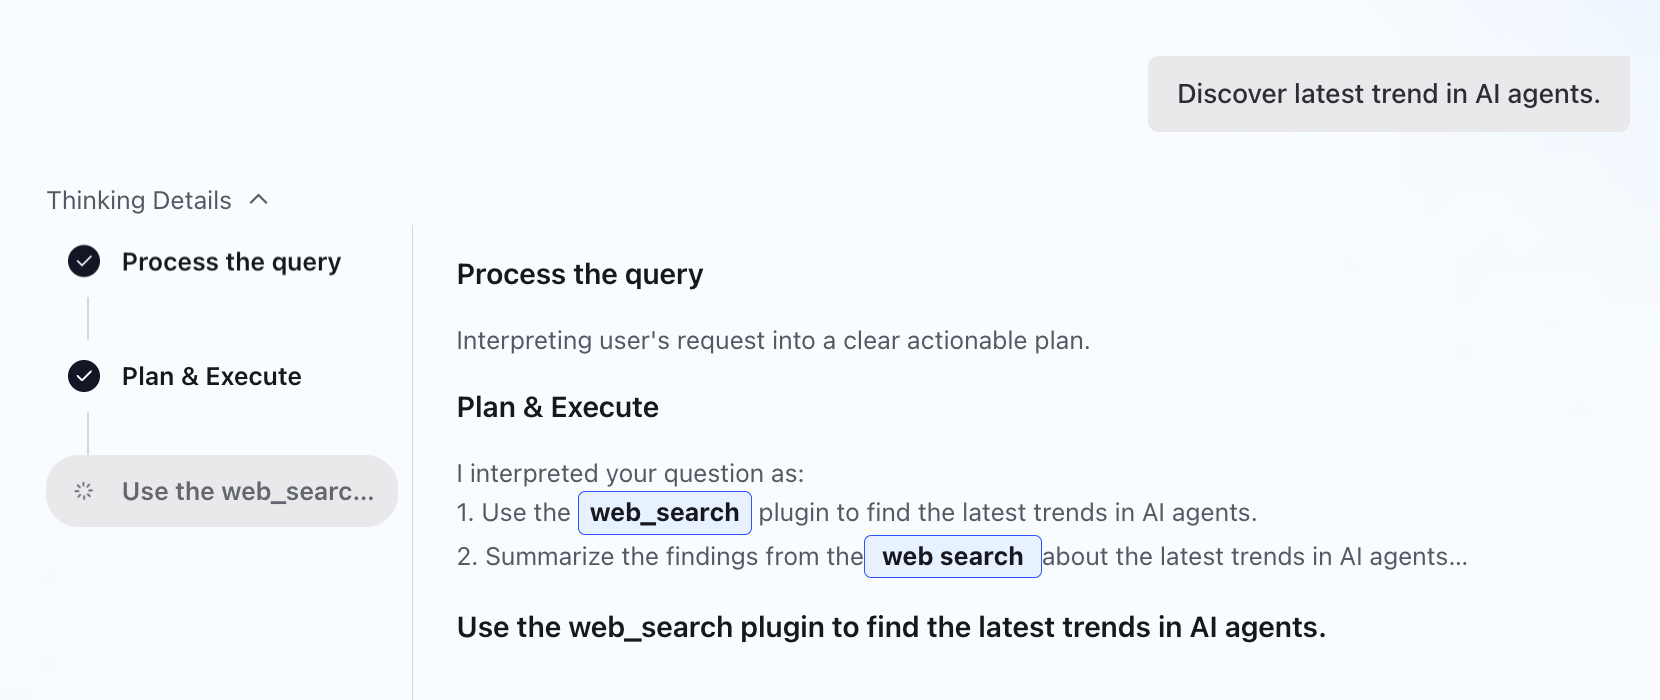
Once the system understands your question, the Web Search plugin retrieves relevant live data directly into your analysis — no app switching required.
External API & API Key
Connect third-party APIs directly to ingest live external data. In addition, each account can generate up to 10 API Keys for one-click integration in Dify's data-analysis tools. Set a monthly quota per key, view usage in real time, auto-pause on limit, and reset at the start of each month.
What is ChartGen AI?
ChartGen AI is a Data agent tool that frees you from manual analysis and report-making. Whether you're a seasoned analyst or a business user with no technical background, you can generate a professional report from any dataset or document — spreadsheets, PDFs, academic papers, business reports, meeting notes — in one click.
- Built-in datasets — start analyzing out of the box
- Upload your own proprietary data too
- Zero code, zero templates, zero barriers — for everyone
- Native support for 12 languages, serving global teams
- Turn messy tables into presentable results in minutes
Beginner FAQ & Billing Quick Reference
Yes — you can connect different tables and CSV files.
About 90% accurate for well-structured data; verify key fields after processing.
Files are processed in memory and deleted after 24 hours (unless saved).
Quick Chat gives instant answers to simple questions; a Deep Report builds a full narrative with multiple sections, charts, and logic.
Usually 10–15 minutes, depending on complexity and data volume.
Yes — adjust the original request and have the system rerun or refine a specific part.
The permanently free plan gives 100 credits/month; the Growth plan also has a 7-day free trial.
After paid credits run out, 50 credits refresh when depleted or at next login — valid for 24 hours, non-cumulative, up to 5 refreshes per cycle.
Verify with an academic email (.edu, .ac.uk, .edu.cn, etc.) to subscribe to a 10%-off education plan.
Major credit cards via Stripe; invoices can be downloaded under Management > Billing > Invoices.