

How to Turn Your Analysis into a Professional PPT
Build a complete slide deck from your data and analysis with ChartGen AI. Describe the story you want to tell, get slides with charts and talking points, then edit and export to .pptx — no slide-by-slide design.
When it's time to present, you need slides — not a spreadsheet. ChartGen AI turns your data and analysis into a complete slide deck: a title, a clear narrative arc, one idea per slide with a supporting chart, and speaker-ready talking points. Then you edit it and export a real .pptx.
By the end you'll know how to:
- Generate a full slide deck from your analysis
- Shape the narrative and slide order with a prompt
- Edit slides, charts, and speaker notes
- Export to
.pptxfor PowerPoint or Keynote
Step-by-Step Walkthrough
Step 1: Start from Your Data or Analysis
Upload the dataset, or start from an analysis or report you've already built in ChartGen AI. Working from an existing analysis means the charts and numbers on your slides are already the ones you trust.
Step 2: Decide the Story You're Telling
A deck is a narrative, not a data dump. Settle the one message you want the audience to leave with, then the 3–5 points that support it. This becomes the slide order: setup → evidence → takeaway → next steps.
Step 3: Write the Deck Prompt
Describe the audience, the story, and roughly how many slides. ChartGen AI builds the outline, writes each slide, and picks the right chart per point.
Turn my analysis into a 10-slide presentation for a leadership review. Open with a title and one-line summary, then walk through the key trends with a chart on each slide, call out risks, and close with recommendations and next steps. Add short speaker notes to each slide and use a clean, professional theme.
Step 4: Generate the Slide Deck
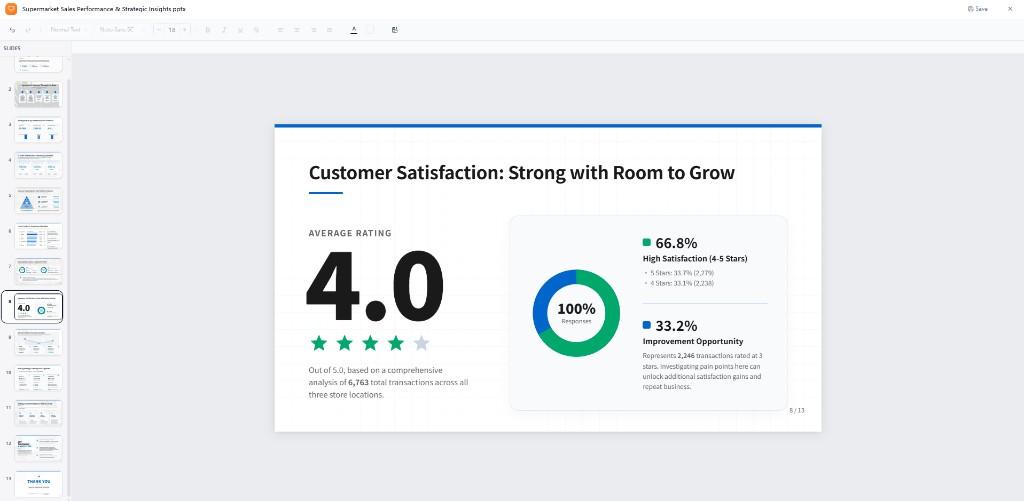
ChartGen AI produces the full deck — titles, bullet points, charts, and a consistent visual theme — following the narrative you described. Each slide keeps to one idea so it reads well from the back of the room.
Step 5: Edit Slides and Notes
- "Combine slides 4 and 5 into one."
- "Make the chart on slide 3 a line chart instead."
- "Shorten the bullets to five words each."
- "Add a closing slide with contact details."
Step 6: Export to .pptx
Export a real .pptx that opens in PowerPoint, Keynote, or Google Slides — with editable text, native charts, and your speaker notes intact. Do a final pass in your usual tool if you like, or present straight from the export.
Conclusion
The gap between "I finished the analysis" and "the deck is ready" usually eats an afternoon. ChartGen AI closes it: describe the story once, get a structured deck with charts and notes, refine in plain language, and export a .pptx you can present with confidence.
Try it yourself
Upload your data and describe what you need — ChartGen AI builds it in seconds.
Try ChartGen AI free →