
Mind maps mirror how the brain organizes information—associatively, not linearly. In 2026, AI mind map generators can turn a single prompt or pasted document into a hierarchical structure in seconds. This guide covers six high-value use cases, how generation works across three methods, why static image output is a different product than an editable canvas, a practical creation flow, eight design principles, and how to pick a tool for your workflow.
1. The 60-second mind map
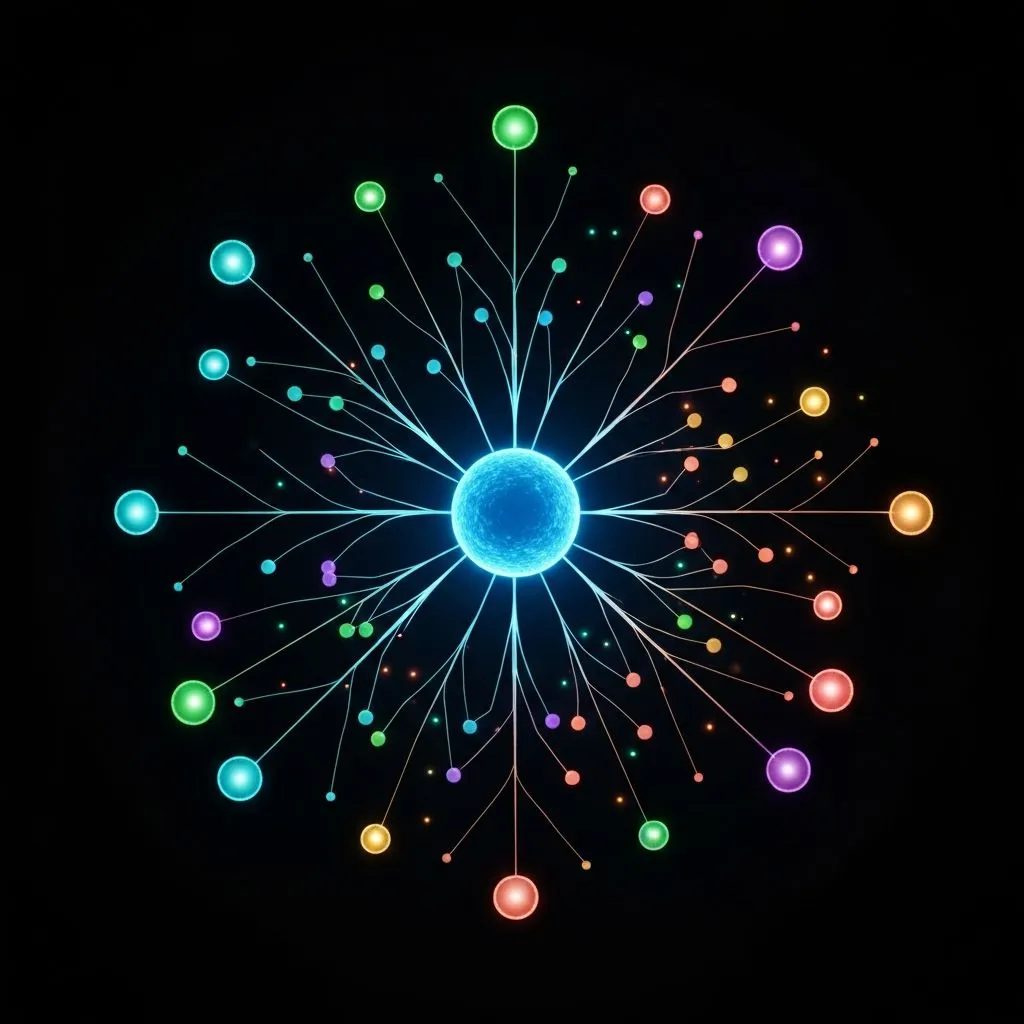
Mind maps are radial diagrams: a central idea branches into related concepts, sub-topics, and details. Teams use them for brainstorming, project planning, notes, research synthesis, and knowledge organization.
The old friction was manual: boxes, connectors, layout tweaks, and color rules—work that pulls you out of thinking and into formatting.
Today, you can type a topic, paste a document, or describe what you want to organize, and the model proposes structure in seconds.

Ask for something like “a mind map of the LLM market landscape” and you can get branches for OpenAI, Anthropic, Google, Meta, open source, and Chinese LLMs—with sub-nodes for model families—without hand-drawing the layout.
The shift is not only speed. It is making visual organization feasible for tasks where you would have skipped the map because the overhead was too high.
2. Six high-value use cases
Mind maps are not only brainstorming—they are a lightweight architecture for meaning.


1. Brainstorming and ideation
Generate many ideas and see cross-domain connections. Some tools surface links humans miss; teams also report faster delivery when ideation is less bottlenecked by manual layout.
Example prompt: “Brainstorm marketing strategies for a B2B SaaS product launch.”
2. Project planning and task breakdown
Turn messy lists into ordered timelines and dependency trees. Models can decompose goals into sub-tasks, flag dependencies, and suggest parallel workstreams.
Example prompt: “Create a project plan for launching a mobile app in Q3.”
3. Knowledge organization and study notes
Group material into topic trees, spot gaps, and structure revision. NotebookLM and similar products can ingest documents and produce visual outlines.
Example prompt: “Organize my notes from this semester’s biology course.”
4. Research synthesis and literature review
Turn dense sources into maps that expose relationships and gaps. Full-text ingestion can help surface themes, tensions, and unexplored angles.
Example prompt: “Synthesize the key arguments from these five research papers on climate policy.”
5. Meeting prep and decision documentation
Structure talking points, capture decisions, and visualize options. Start from an agenda map, then expand each branch with discussion prompts.
Example prompt: “Create a decision tree for our pricing strategy options.”
6. Content outlining and information architecture
Plan posts, curricula, or documentation hierarchies. Models can propose section breaks and missing topics.
Example prompt: “Outline a comprehensive guide to machine learning for beginners.”
Mind maps work because they match associative memory. AI accelerates the structural pass so you stay closer to the ideas.
3. How AI mind map generation works: three methods

Method 1: Topic expansion (prompt-to-map)
Best for exploration when you do not have a canonical document.
- Input: A topic or question (“The future of renewable energy”).
- Process: The model proposes a hierarchy from general knowledge.
- Output: A multi-level map in one shot.
- Limitation: Grounding comes from training data, not your private files—unless the tool adds retrieval.
Method 2: Document analysis (text-to-map)
Best for synthesis and study.
- Input: Notes, articles, or pasted text.
- Process: Extract concepts, infer relationships, and nest them.
- Output: A map that summarizes the source.
- Limitation: Quality tracks source clarity; garbage in, noisy structure out.
Method 3: Conversational refinement (chat-to-map)
Best for messy topics that need iteration.
- Input: A seed prompt plus follow-ups.
- Process: Maintain context and revise structure as you steer.
- Output: A map shaped by dialogue.
- Limitation: Takes more turns; not every product preserves context well across edits.
The processing pipeline

Under the hood, capable systems chain steps such as entity extraction, relationship detection, hierarchy inference, and layout optimization—then render to an interactive canvas, vector, image, or structured data.
The critical fork is output type. Some tools return a picture. Others return editable objects you can drag, relabel, and extend. That difference matters more than “AI on” marketing.
4. The static vs editable gap
The problem with static image output
General image models can draw something that looks like a mind map. The file is still pixels—not nodes.

Common limits include: no true node edits, weak spell-check on labels, no drill-down on branches, no live collaboration, limited export options, and any fix forcing a full regeneration.
What editable interactive maps add


If you need a disposable screenshot, static can be enough. If you need iteration, collaboration, or downstream reuse in docs and decks, editable structure is the right target.
5. Step-by-step: create an AI mind map
Define the central topic
Prefer specific scopes: “Marketing strategies for a Q3 launch” beats “marketing.” Clear centers produce tighter branches.
Choose the input mode
Topic expansion for open exploration; document analysis for grounded synthesis; conversational mode when the first pass will not be final.
Generate the first pass
Many tools return a draft in seconds. Judge coverage: does the map capture the dimensions you care about? Treat v1 as a scaffold, not a verdict.
Edit and refine
Add missing concepts, prune noise, and reshape hierarchy to match your mental model. Use targeted prompts to deepen one branch at a time.
Export and ship
Pick a format for the destination: PNG for slides, Markdown for documents, SVG for design tools, JSON for integrations, or a shared canvas link for teams.
Iteration principle: Strong results often take two to three passes—generate, review, refine. Expect the first structure to land roughly most of the way; apply domain judgment for the remainder.
6. How ChartGen AI approaches mind maps
Most tools sit at extremes: pretty static pictures, or fully manual canvases. The middle path is AI-first structure with immediate editability.

- Natural language input: Describe a topic, paste text, or ask a question.
- Structured generation: Produce hierarchy as data, not as a flat render.
- Instant rendering: Show an interactive canvas with selectable nodes.
- Full manipulation: Edit copy, drag layout, add children from context menus.
- AI-assisted refinement: Expand a branch, suggest adjacent concepts, or tighten wording.
- Multiple exports: PNG, SVG, Markdown, JSON—pick what fits the next step.
The LLM market example earlier is the kind of map you can generate with a single instruction such as “Create a mind map of the LLM market, organized by company and model family,” then refine node-by-node.

If you want structure you can keep working—not a frozen poster—try ChartGen AI.
7. Eight design principles for effective mind maps

- One central topic: Specific and focused, not a vague umbrella.
- Five to seven main branches max: Respect working-memory limits.
- Consistent hierarchy depth: Balance depth across branches when you can.
- Color-code by theme: Same palette per branch family; contrast across families.
- Short labels (about two to five words): Move nuance to notes or attachments.
- Read clockwise from top: Place the most important branch near twelve o’clock.
- Visual weight for emphasis: Size and color for anchors, not decoration everywhere.
- Leave room to grow: Avoid a cramped canvas you cannot extend.
Models often emit balanced hierarchies and terse labels. Your job shifts from drawing to curating when the draft breaks one of these rules.
8. Frequently asked questions
How do I create a mind map with AI?
Pick a generator that matches your output need—editable canvas versus static image—enter a topic or paste text, generate, then edit and export.
Can AI build a mind map from text?
Yes. Document-style inputs are common: paste notes or an article and let the tool extract entities and relationships.
Static AI image vs editable map?
Image generators return a bitmap you cannot truly patch node-by-node. Editable tools return objects you can click, drag, and refine without full regeneration.
Are there free options?
Several products ship free tiers with usage caps. Read export limits before you commit a workflow.
Conclusion: maps are thinking tools, not just diagrams
AI removes the friction that kept mind maps reserved for “big” moments. The durable lesson is workflow: generate, review, refine, use. Let automation handle scaffolding; keep judgment for what belongs in the final structure.
Choose output format on purpose. A static image is a snapshot. An editable canvas stays alive as you think. For knowledge work that evolves, favor the latter.
When you are ready to test the loop on an editable canvas, open ChartGen AI and describe your topic—the map should appear quickly, fully open to iteration.