

Назад к примерам использования Использовать шаблон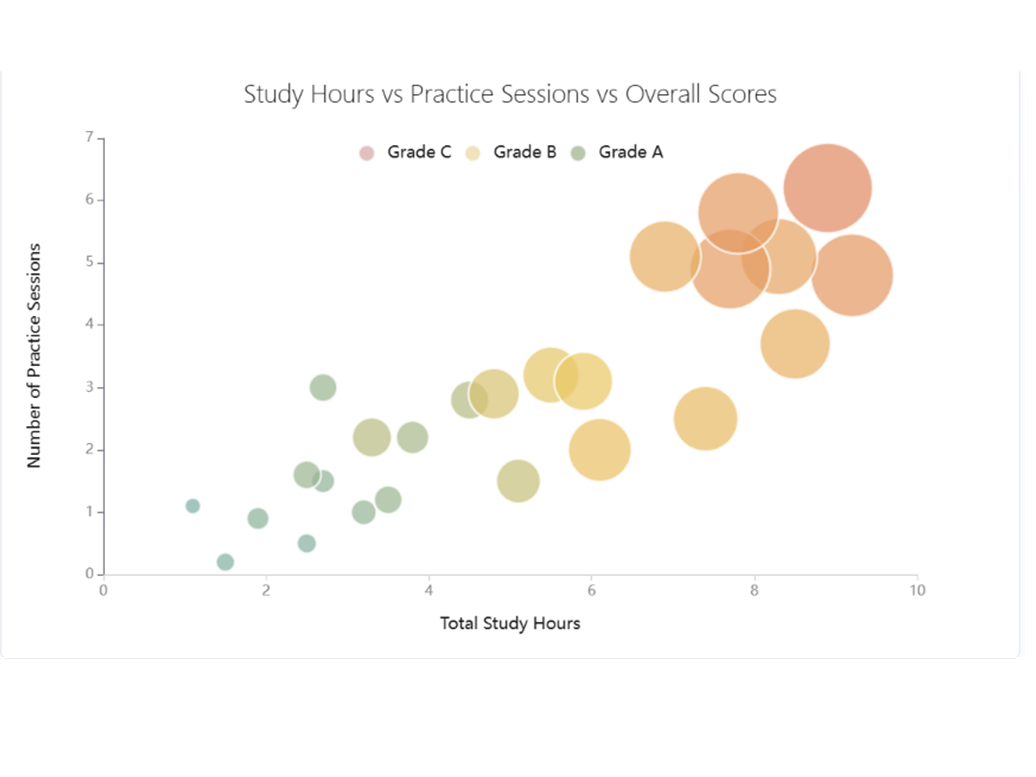
CREATE_CHART
Study Hours vs Practice Sessions (Score-Based)
Description
See the link between study time, practice frequency, and exam scores to spot effective learning patterns.
Input Settings
Action: chartDeep Think: falseWeb Search: False
Recommended Prompt
Create a bubble chart for student data.
X-axis: Total Study Hours
Y-axis: Number of Practice Sessions
Bubble size: Overall Scores (larger = higher score)
Bubble color: Grade (A=soft sage green, B=pale gold, C=muted rose)
The goal is to visualize how time/practice relate to scores with low-saturation colors.
Sample Datasets
Student_Grades.csv
628 B