

How to Create a Course Knowledge Mind Map with ChartGen AI
Learn how to turn a course/module/topic CSV into a clean, radial academic mind map using ChartGen AI. Includes the exact prompt, styling tips, and export options.
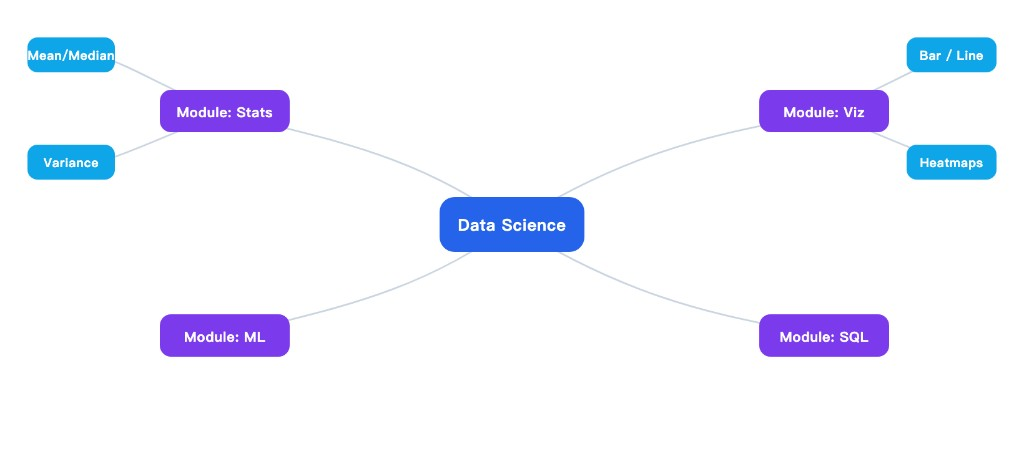
Mind maps show how ideas, lessons, and materials connect. Instead of reading a long table, learners can grasp a curriculum at a glance by seeing the hierarchy between courses, modules, and topics. In this tutorial we turn a CSV into a clean academic-style mind map.
Dataset Overview
The dataset 2.course_knowledge_map_dataset.csv organizes course information into three levels: course, module, and topic. Each row is one topic and shows where it belongs. The course column is the highest level, module the middle, and topic the most detailed.
Step-by-Step Walkthrough
Step 1: Visit ChartGen AI
Open your browser and go to ChartGen AI. You don't need to sign up just to explore chart types. Before uploading, decide what the chart should communicate — here: "What courses exist, what modules belong to each course, and what topics are inside each module?"
Step 2: Prepare Your Data
Make sure the dataset has clear headers and a consistent structure. Each row should describe one complete path: Course → Module → Topic. This tells ChartGen AI to place courses at the main level, modules as branches, and topics as sub-branches.
⚠️ Avoid merged cells, unclear column names, or missing parent values. Don't leave the course column blank — ChartGen AI needs it to know where each topic belongs.Step 3: Upload or Paste Data
Upload 2.course_knowledge_map_dataset.csv, or paste directly from Excel / Google Sheets. Confirm ChartGen AI recognizes the three key columns: course, module, and topic. At this stage it's still a table — the next step turns it into a mind map.
Step 4: Describe Your Chart
Type a natural-language prompt that says exactly what you want:
Build a mind map based on course, module, and topic data to represent the knowledge structure. The diagram should clearly show hierarchical relationships between courses, modules, and detailed topics. Ensure the structure is clean and suitable for learning path visualization, using balanced radial layout, soft academic color tones, consistent typography, and thin, well-aligned connectors to create a neat, high-quality and visually structured diagram.
This prompt works because it specifies four things: the chart type (mind map), the hierarchy (course/module/topic), the purpose (learning-path visualization), and the style (radial layout, soft colors, clean typography, thin connectors). A weak prompt like "Create a chart from this data" is too vague.
Step 5: Generate and Customize
Click Generate. Review the first version against this checklist:
| What to Check | Good Output Looks Like |
|---|---|
| Course level | Main course names appear as primary branches |
| Module level | Each module grouped under the correct course |
| Topic level | Topics appear as smaller nodes under modules |
| Layout | Branches balanced and not crowded |
| Connectors | Lines thin, clear, and aligned |
Refine with follow-up prompts when needed:
- "Simplify the layout, reduce node overlap, and increase spacing between modules while keeping the hierarchy clear."
- "Use softer academic colors — light blue, pale green, muted yellow, soft lavender — while keeping text readable."
- "Make course nodes larger, module nodes medium, and topic nodes smaller so the three levels are easier to distinguish."
Step 6: Export Your Chart
Once the map looks right, export it for course docs, presentations, or LMS pages. ChartGen AI supports export in formats such as PNG, PDF, Word, and PPT. Use PPT for a curriculum-planning meeting, or PNG to embed in a website or online course page.
Conclusion
We created a course knowledge mind map from a CSV with course, module, and topic columns. We prepared the data, uploaded it, wrote a detailed prompt, generated the map, refined layout and styling, and exported the result. Whenever you need to turn structured educational content into a visual learning path, a clear dataset plus a specific prompt lets ChartGen AI produce a clean, presentation-ready knowledge map.
Try it yourself
Upload your data and describe what you need — ChartGen AI builds it in seconds.
Try ChartGen AI free →