

How to Extract and Export a Structured Excel Table with ChartGen AI
Pull clean, structured tables out of PDFs, documents, or messy data and export them to Excel with ChartGen AI. Describe the table you need in plain language and download a ready-to-use .xlsx — no manual copy-paste.
Sometimes you don't want a chart — you want clean rows and columns you can open in Excel. ChartGen AI can read a PDF, document, or raw dataset, pull out the exact table you describe, clean it up, and export a ready-to-use .xlsx file. No manual copy-paste, no reformatting.
By the end you'll know how to:
- Extract a structured table from files or messy data
- Clean, rename, and reshape columns with a prompt
- Add computed columns and summary rows
- Export a formatted
.xlsxfile
Step-by-Step Walkthrough
Step 1: Upload the Source
Upload whatever holds the data — a PDF report, a Word doc, a scanned invoice, a messy CSV, or an existing spreadsheet. ChartGen AI reads the content and finds the tabular parts, even when they're buried in paragraphs or spread across pages.
Step 2: Describe the Table You Want
Tell ChartGen AI exactly which columns to pull and how to name them. Being specific here is what turns a rough extraction into a clean, usable table.
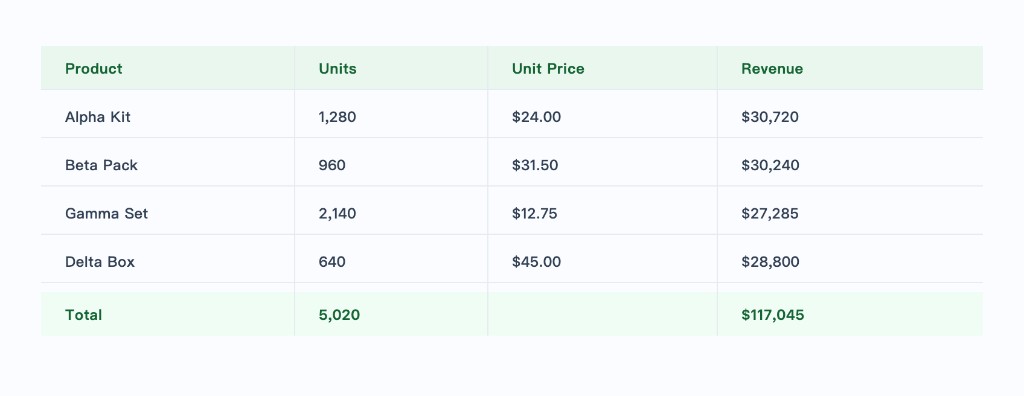
Extract a structured table from this file with columns: Product, Units Sold, Unit Price, and Revenue. Clean up inconsistent formatting, convert prices to numbers, and sort by Revenue descending.
Step 3: Clean and Reshape
Once the table appears, fix anything off with follow-up instructions — no formulas needed:
- "Split the 'Name' column into First and Last."
- "Remove rows with missing prices."
- "Format the date column as YYYY-MM-DD."
- "Standardize the currency to USD."
Step 4: Add Computed Columns and Totals
Ask for derived values so the exported file is analysis-ready: "Add a Revenue column = Units × Unit Price", or "Add a total row at the bottom summing Units and Revenue." ChartGen AI computes the values and keeps them consistent with the source rows.
Step 5: Export to Excel
Export the table as .xlsx (or .csv). The download preserves your column names, number formats, and the total row, so you can open it in Excel, Google Sheets, or Numbers and keep working immediately.
Tip: If you'll re-run this on new files each month, save the prompt. Re-uploading a fresh file and re-sending the same prompt reproduces the exact same table structure.
Common Use Cases
| Source | What you extract |
|---|---|
| PDF report | Financial figures into a clean model-ready table |
| Invoices / receipts | Line items, quantities, and totals |
| Long document | A comparison table pulled from the text |
| Messy CSV | A deduplicated, standardized version |
Conclusion
Getting a clean spreadsheet out of a stubborn PDF or a messy file used to mean tedious copy-paste. With ChartGen AI you describe the table you need, refine it conversationally, and export a formatted .xlsx in minutes — data extraction and cleanup handled in one place.
Try it yourself
Upload your data and describe what you need — ChartGen AI builds it in seconds.
Try ChartGen AI free →