

How to Create a Diagram with ChartGen AI
Turn a list, table, or block of text into a clean mind map, flowchart, or org diagram with ChartGen AI. Describe the structure in plain language and export a shareable diagram — no drawing required.
Not every idea is a number. Relationships, processes, and hierarchies are best shown as diagrams — mind maps, flowcharts, org charts, or concept maps. ChartGen AI turns a plain list, table, or paragraph of text into a clean, structured diagram, so you never have to drag boxes and align arrows by hand.
By the end you'll know how to:
- Turn structured text into a diagram
- Choose the right diagram type for your content
- Refine layout, grouping, and style in plain language
- Export the diagram for docs, slides, or the web
Step-by-Step Walkthrough
Step 1: Prepare the Structure
Diagrams need a structure, not just data. A two-column table (parent → child), an indented list, or a short description of steps all work. For a flowchart, list the steps in order; for a mind map, list topics and sub-topics; for an org chart, list who reports to whom.
Step 2: Pick the Diagram Type
Match the shape to the meaning: a mind map for branching topics, a flowchart for a process with steps and decisions, an org / tree chart for hierarchy, and a concept map for many-to-many relationships.
Step 3: Write the Diagram Prompt
Name the diagram type, the root/starting node, and how items connect.
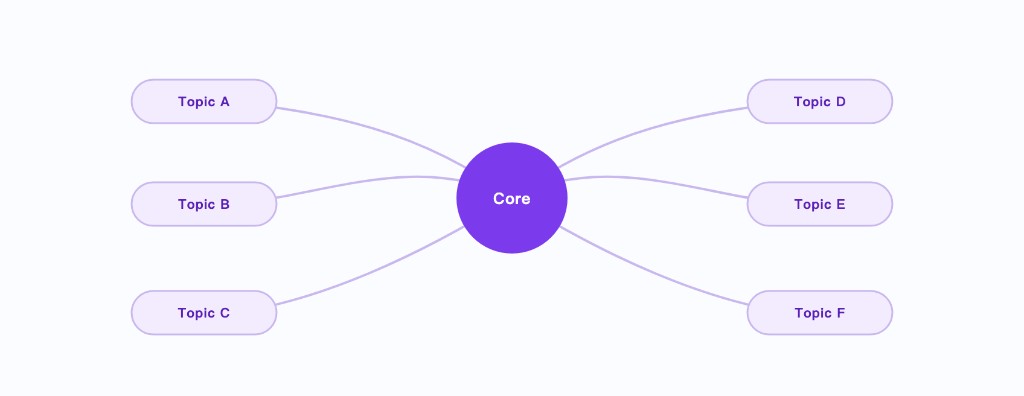
Create a radial mind map from my topic list. Put the main subject in the center, each top-level topic as a branch, and its sub-topics as leaves. Group related branches by color, keep labels short, and use a clean, modern style.
Step 4: Generate the Diagram
ChartGen AI lays out the nodes, routes the connectors so they don't overlap, and applies a consistent color and typography scheme. The structure comes straight from your input, so nothing is invented.
Step 5: Refine Layout and Style
- "Lay it out left-to-right instead of radial."
- "Color each main branch differently."
- "Add a decision diamond after step 3."
- "Make the spacing tighter so it fits one slide."
Step 6: Export the Diagram
Export as PNG or SVG — SVG stays sharp at any size and is ideal for slides and print. You can also drop the diagram directly into a report or PPT within ChartGen AI.
Conclusion
Diagrams communicate structure the way charts communicate numbers. Give ChartGen AI a clear outline of your topics or steps, name the diagram type, and it handles the layout and styling — turning a messy list into a diagram you'd be happy to present.
Try it yourself
Upload your data and describe what you need — ChartGen AI builds it in seconds.
Try ChartGen AI free →