ユースケースに戻る テンプレートを使用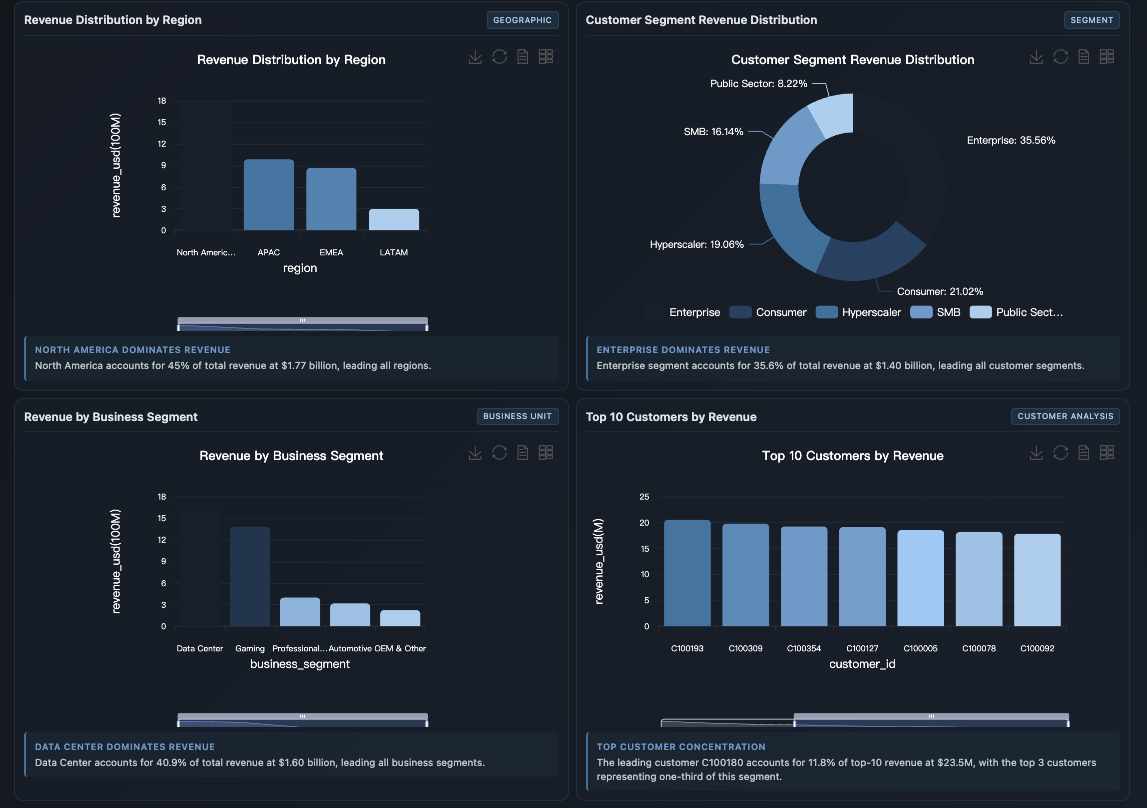
BUILD_DASHBOARD
Company Revenue Performance Dashboard
Description
A company-level revenue dashboard analyzing performance over time, revenue mix, and key business drivers using detailed transaction data.
Input Settings
Action: dashboard
Recommended Prompt
Build a company revenue performance dashboard using the provided transaction-level and customer datasets for NVIDIA (NVDA).
Focus on analyzing revenue performance from multiple business perspectives, including:
Revenue trends over time (by date and fiscal quarter)
Revenue contribution by business segment and product family
Revenue mix by region, customer segment, and sales channel
Key revenue drivers such as pricing, volume, and discount levels
Present the dashboard in a clean, finance-grade style suitable for business analysis and executive review.
Use tables and charts where appropriate, and allow key metrics to be easily filtered by time period, segment, and region.
Sample Datasets
nvda_customers.csv
17.00 KB
nvda_revenue_transactions.csv
1.14 MB