

How to Turn Your Analysis into a Professional PPT
Turn your data analysis into a professional slide deck with ChartGen AI. Auto-build a business narrative, edit slides in the built-in editor, and export to .pptx.
Charts alone don't make a presentation. ChartGen AI translates your analytical findings into a professional slide deck — not just a pile of charts, but a cohesive business narrative with a data overview, deep-dive insights, next steps, and closing remarks. You can edit it in a built-in editor and export to .pptx.
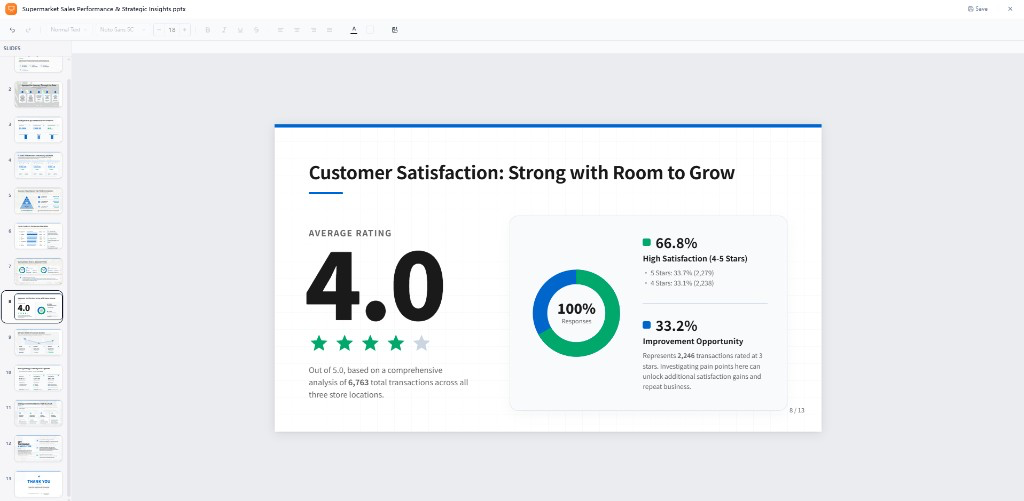
Step-by-Step Walkthrough
Step 1: Start From Your Analysis
Do your analysis first — query your data, generate charts, or run a Deep Report. The stronger your artifacts, the richer the deck. Working inside a Project lets ChartGen AI pull together everything you've produced.
Step 2: Ask ChartGen AI to Build the Deck
Use the Build PPT quick action, or describe the presentation you want:
Create a presentation for the leadership team summarizing this analysis. Include a title slide, a data overview, the top 3 insights with supporting charts, recommended next steps, and a closing summary. Keep the tone executive and concise.
Rather than compiling isolated charts, ChartGen AI constructs a full narrative — integrating a data overview, deep-dive insights, actionable next steps, and standard concluding remarks into a complete deck.
Step 3: Review and Edit in the Built-In Editor
ChartGen AI includes a native presentation editor. Review the deck, edit text, and refine slide layouts directly in the platform — no switching applications.
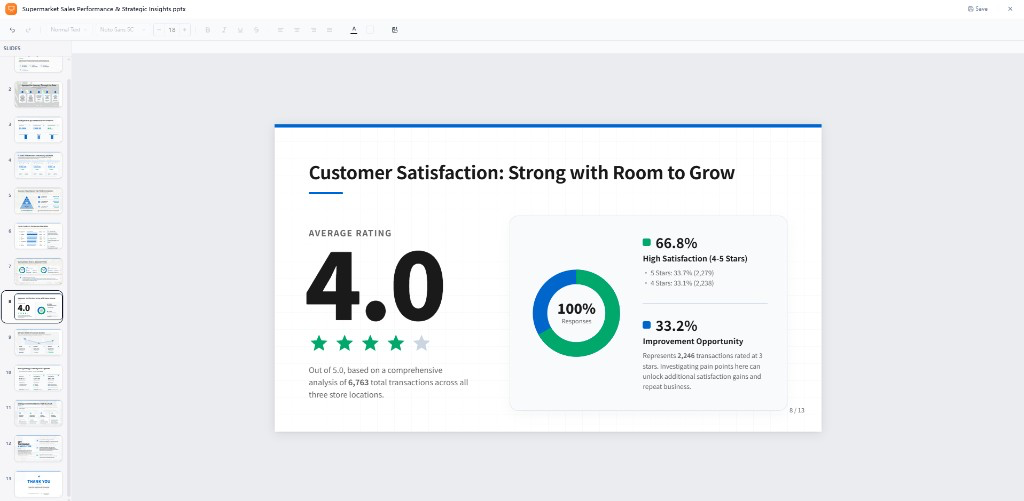
Step 4: Refine With Natural Language (AI Edit)
You can also just describe changes in chat. AI Edit works across every artifact type, including presentations:
On the insights slide, make the revenue chart larger and add a one-line takeaway under each bullet. Use a blue accent color throughout the deck.
Step 5: Export to .pptx
Once the deck is polished, download the final output in standard .pptx format — ready to open in PowerPoint or Keynote and present.
Conclusion
ChartGen AI turns analysis into a boardroom-ready presentation end to end: it builds a structured narrative, lets you edit slides in a native editor or via natural language, and exports to .pptx. Instead of manually assembling charts into slides, you describe the deck you want and refine from there.
Try it yourself
Upload your data and describe what you need — ChartGen AI builds it in seconds.
Try ChartGen AI free →