

How to Generate a Full Deep Report from Raw Data
Use ChartGen AI's Deep Report to turn raw data into a multi-section professional report with charts, tables, and insights — then export to HTML, PPT, Word, or PDF.
A quick query answers one question. A Deep Report tells the whole story. ChartGen AI runs a long-form reasoning chain over your data and produces a professional-grade report — complete with charts, tables, and structured insights — typically in 5–15 minutes, ready to export to HTML, PPT, Word, or PDF.
Deep Report vs. Quick Query
| Quick Data Query | Deep Report | |
|---|---|---|
| Best for | Fast answers to simple prompts | A full analytical narrative |
| Output | A chart, table, or summary | Multi-section report with charts, tables & logic |
| Time | Seconds | ~5–15 minutes |
Step-by-Step Walkthrough
Step 1: Upload Your Data or Document
Deep Report works with structured data (CSV, Excel) and whole documents (PDF, DOCX, papers, business reports). Upload up to 10 files (max 100MB each). For complex documents mixing tables and narrative, choose Data Extraction so ChartGen AI pulls out the tables first.
Step 2: Click "Write Report" and Describe the Goal
On the homepage, click Write report and submit a natural-language query. Be specific about audience, scope, and the decision the report should support:
Write a quarterly business review for the leadership team based on this sales data. Cover revenue and margin trends, top and bottom performing categories, key drivers behind the changes, and 3 concrete recommendations. Use charts for every major point.
Step 3: Enable Deep Analysis for Depth
💡 Tip: Turn on the Deep Analysis toggle in the input box to get a more in-depth, comprehensive report. It adds multi-step reasoning, autonomous planning, and reflection.
Step 4: Let ChartGen AI Run the Reasoning Chain
Unlike instant queries, Deep Report runs a long-form reasoning chain and assembles a structured document. It first generates the content in Markdown, so you can review the full narrative, charts, and tables before exporting.
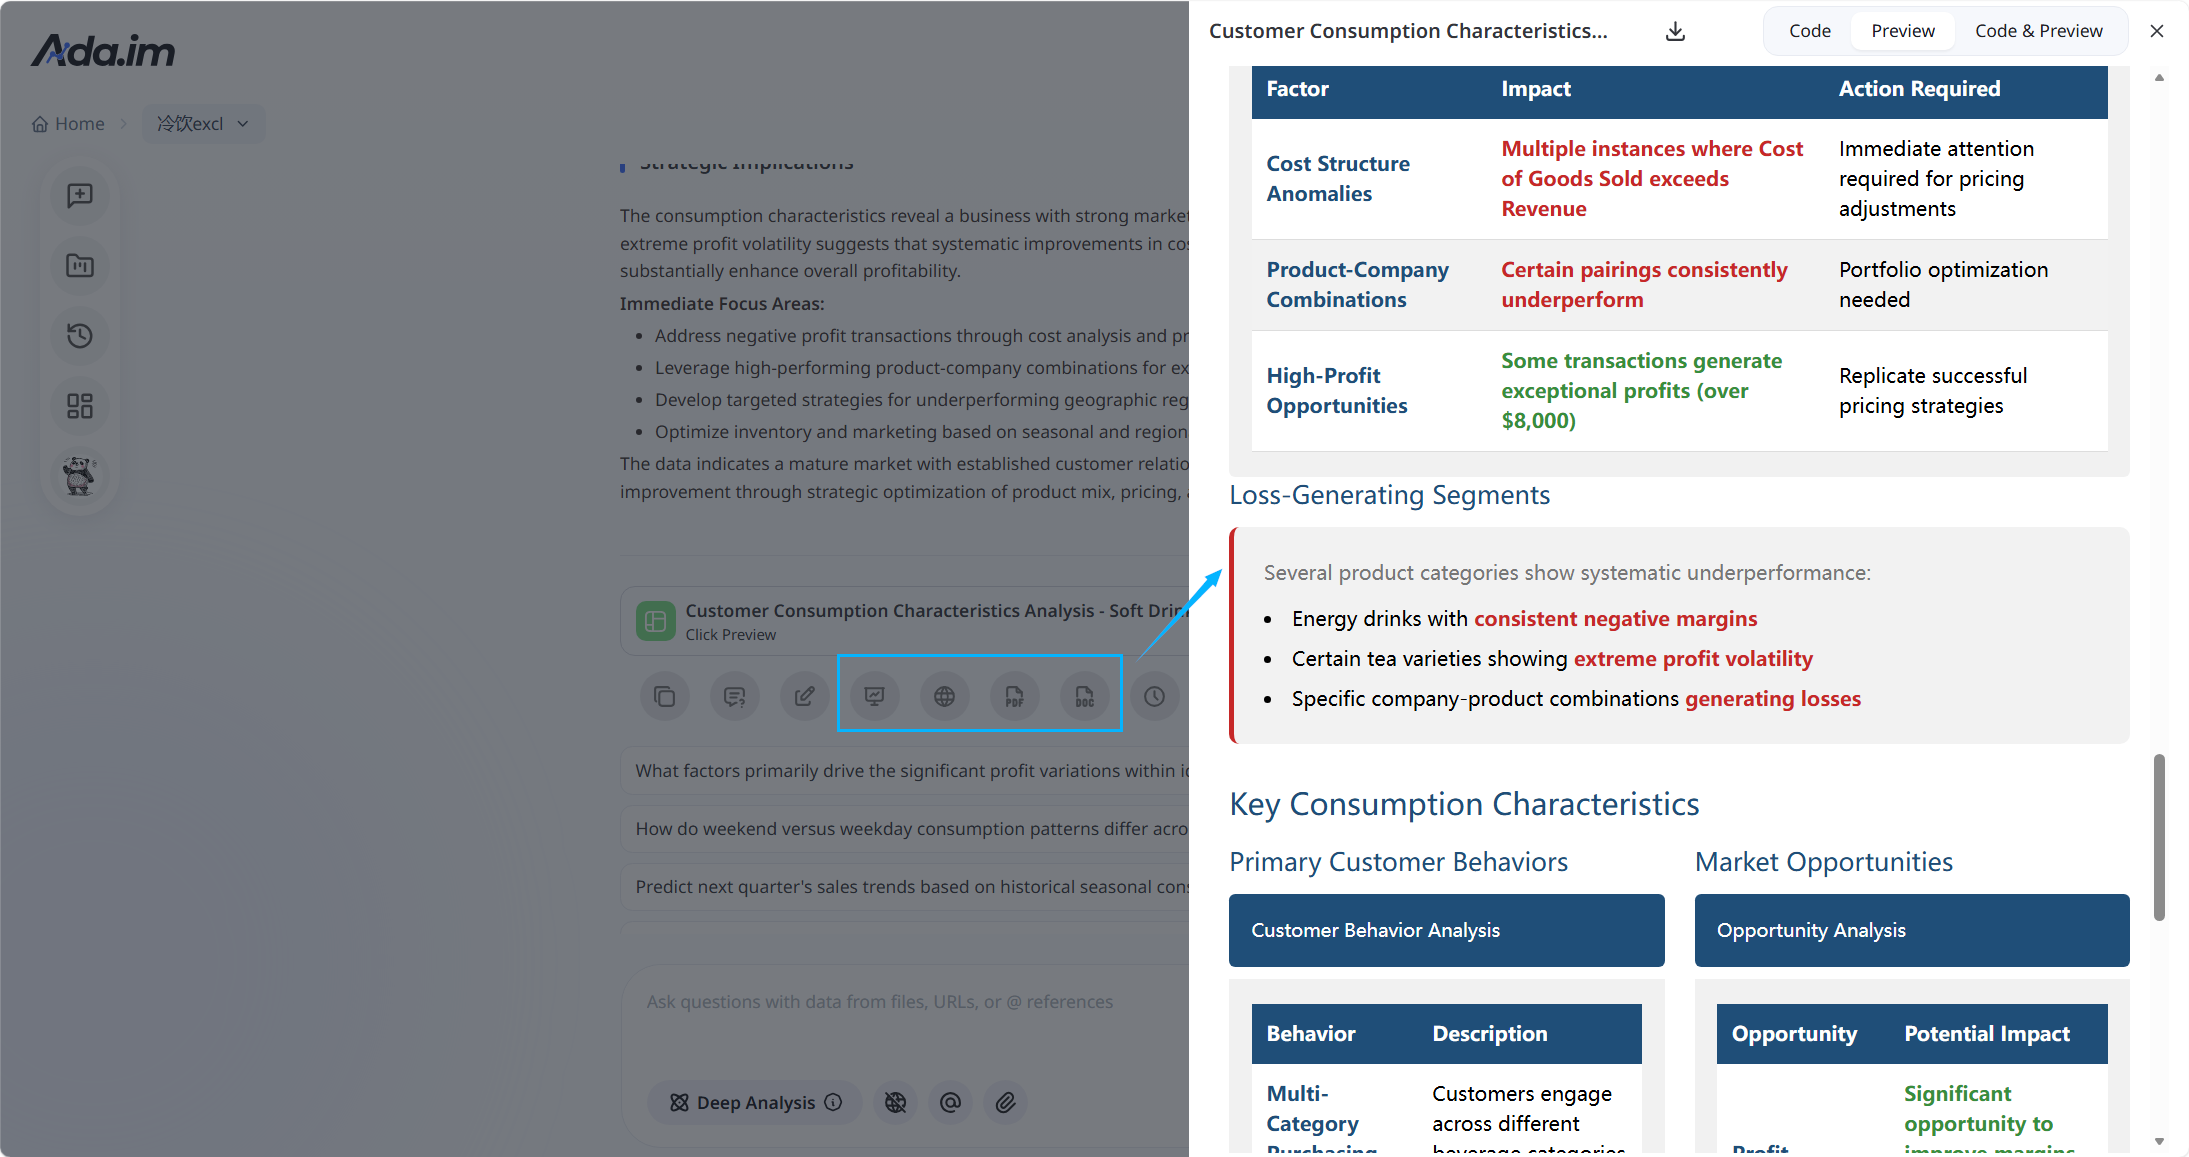
Step 5: Export in the Format You Need
Use the export buttons at the bottom of the page:
| Format | What you get | Best for |
|---|---|---|
| HTML / PPT | Enhanced deliverable rebuilt with visualizations and structured layout | Presenting & sharing |
| Word / PDF | Direct download of the Markdown content | Archiving & distribution |
Step 6: Revise or Regenerate
Need changes? Tweak your original query — add data, sharpen the focus, or ask ChartGen AI to re-run or refine specific sections. Every version is tracked, so you can compare and roll back.
Conclusion
Deep Report compresses hours of manual analysis and writing into a single prompt. Upload your data, click Write Report, describe the goal, and (optionally) enable Deep Analysis — then export a polished report to HTML, PPT, Word, or PDF. It's the fastest path from a messy dataset to a stakeholder-ready deliverable.
Try it yourself
Upload your data and describe what you need — ChartGen AI builds it in seconds.
Try ChartGen AI free →