

How to Forecast Next Quarter's Revenue with Time-Series Prediction
Use ChartGen AI's Prediction feature to extend any time-series chart into the future. Forecast next quarter's revenue based on historical patterns and plan ahead.
Planning ahead means knowing where a metric is likely to go. ChartGen AI's Prediction feature uses time-series forecasting to extend any trend chart into the future, analyzing historical patterns to generate forward-looking projections — so you can anticipate change and plan budget, staffing, and inventory.
What Prediction Does
Prediction analyzes historical patterns — trend, seasonality, and recent momentum — and projects the metric forward. It's ideal for revenue planning, demand forecasting, risk exposure, and any KPI where "what happens next" drives a decision today.
Step-by-Step Walkthrough
Step 1: Prepare a Time-Series Dataset
Upload data with a clear date column and the metric you want to forecast (e.g., monthly revenue). For best results, work inside a Project so ChartGen AI keeps context and can combine the forecast with attribution and reporting later.
Step 2: Generate the Historical Trend Chart
Ask for the metric over time:
Show monthly total revenue for the last 24 months as a line chart.
ChartGen AI renders the historical time series that the forecast will extend.
Step 3: Click the Prediction Button
At the bottom-left of the chart, click Prediction. ChartGen AI extends the time series into the future, producing forward-looking projections based on the historical patterns it detected. You can also ask directly:
Forecast total revenue for the next quarter based on current trends, and show the projection as a dashed extension of the existing line.
Step 4: Read the Forecast
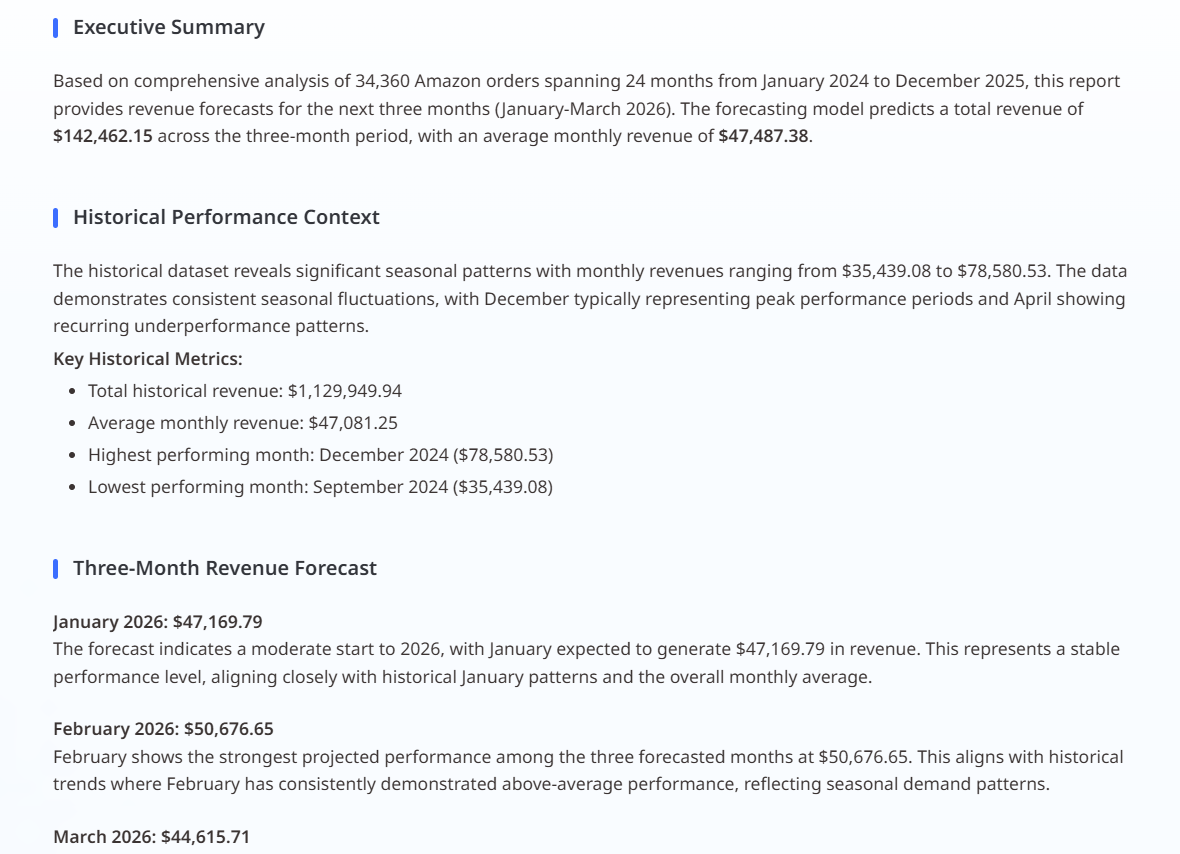
The forecast appears as an extension of your chart, typically with projected values per future period. A typical readout:
| Month | Forecast revenue | Note |
|---|---|---|
| January | $47,149.79 | Slight rebound after year-end dip |
| February | $50,676.55 | Continued growth on historical trend |
| March | $44,615.71 | Seasonal softening |
Use these projections to anticipate potential changes and plan ahead — for example, adjusting ad budget or inventory depth before the softer month.
Step 5: Stress-Test with Scenarios (optional)
Because Prediction lives in the same conversation, you can immediately explore scenarios: "Show a short-term revenue prediction under a 20% higher ad budget" — pairing forecasting with [attribution](revenue-attribution-analysis.html) to connect drivers to outcomes.
Conclusion
With ChartGen AI, forecasting is one click away: generate a trend chart, hit Prediction, and get a forward-looking projection grounded in your historical data. Combined with attribution and scheduling, a one-time forecast becomes a repeatable planning workflow — helping teams move from reacting to anticipating.
Try it yourself
Upload your data and describe what you need — ChartGen AI builds it in seconds.
Try ChartGen AI free →