
Quick answer: A2UI (Agent-to-UI) is an open-source protocol created by Google that enables AI agents to generate rich, interactive user interfaces — forms, charts, maps, dashboards — instead of plain text responses. Released in December 2025 (v0.8 public preview), A2UI lets agents send declarative JSON component descriptions that client applications render as native interactive widgets. For data teams, this means AI can output explorable dashboards instead of bullet-point summaries, changing how we interact with AI for data analysis and visualization.
1. Your AI agent has been talking when it should have been showing
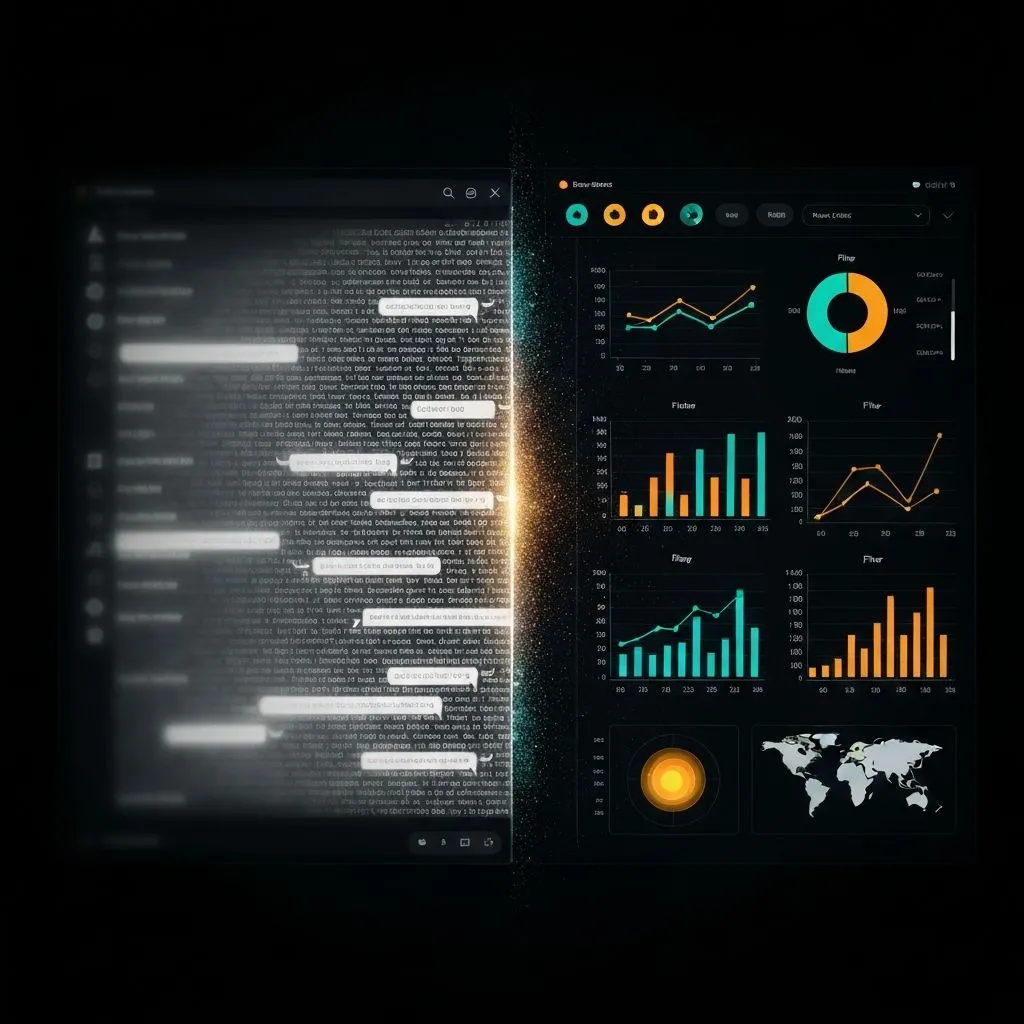
The chatbot paradigm was never designed for data
Ask a general-purpose assistant to analyze quarterly sales data. What do you get? A wall of text. Bullet points. Maybe a code block you need to copy into a notebook to actually see the chart. The model may understand your data — but it often answers in the most primitive format: paragraphs.
Since 2022, we have been interacting with remarkably capable models through a linear, text-only chat window — the same basic shape as classic IRC. The system can reason about complex datasets, flag anomalies, and propose recommendations — yet the interface is a scrolling list of messages you read top to bottom and then forget.
In December 2025, Google open-sourced A2UI (Agent-to-UI) — a protocol that lets agents generate rich, interactive user interfaces instead of plain text. Forms, date pickers, charts, maps, dashboards — rendered natively in your application, generated on the fly by the agent.

The real-world demo is compelling: Google showed a restaurant-finder agent generating a booking form with a date picker, time selector, and submit button — instead of the painful multi-message text back-and-forth many chatbots require for a simple reservation. For data teams, the implication is sharper: the agent can generate an explorable dashboard instead of a description of the data.
2. What is A2UI? A plain-English explainer
The protocol that lets agents build interfaces instead of writing paragraphs
A2UI (Agent-to-UI) is an open-source protocol that lets agents send declarative UI descriptions — JSON messages describing buttons, forms, charts, maps, and layouts — to a client, which renders them as native interactive components. Think of it as “HTML for agents,” with stronger safety and portability defaults.
The problem A2UI solves: trust boundaries
We are in the era of multi-agent systems. Agents on different servers and from different vendors coordinate. They cannot directly touch your UI.
The old pattern? Ship raw HTML or JavaScript inside iframes — heavy, visually disjointed, and a security headache. A2UI’s approach: transmit UI that behaves like data but reads like design. The agent sends a JSON blueprint; the client renders it with its own native widgets.
How it works: the three-message pattern

surfaceUpdate
Describes the UI component tree — what to show. A date picker here, a chart there, a submit button below.
dataModelUpdate
Provides the application state — what data to display. The chart series, the map coordinates, the form defaults.
beginRendering
Triggers the render — when to show it. The client assembles components with data and displays the interface.
For the restaurant booking example: the agent sends JSON describing a date picker, time selector, party-size dropdown, and submit button. The client renders each piece with its own UI framework (React, Angular, Flutter, Lit), applies its own styling and accessibility standards, and presents a coherent form. No iframe. No foreign code execution.
Three core design principles

Security first
Declarative data, not executable code. The agent requests components from a trusted catalog — reducing arbitrary code execution risk compared with shipping opaque scripts.
Native feel
No iframes. The client renders with its own UI framework so generated UI can inherit app styling, accessibility, and performance characteristics.
LLM-friendly structure
A flat component list with ID references is easier for models to generate, correct, and stream progressively than an ad-hoc soup of markup.
The ecosystem (v0.8 public preview)
A2UI is at v0.8 public preview, released under the Apache 2.0 license. Stable renderers exist for Lit, Angular, and Flutter (via Google’s GenUI SDK). React support was slated for Q1 2026, with SwiftUI and Jetpack Compose planned for Q2. The protocol supports multiple transports including the A2A protocol, AG UI, SSE, and WebSockets.
Day-zero ecosystem partners include CopilotKit/AG UI (compatibility layer), Opal (AI mini-apps), Gemini Enterprise, and Flutter’s GenUI SDK. This is Google’s bet on an open standard for agent-driven interfaces — and the data visualization implications are large.
3. Why chatbots fail at data analysis: the five walls
A chat window is the wrong interface for exploring data
Chat works for Q&A, writing, and code generation. It fails badly for analysis that should be spatial, interactive, and visual. Here are five walls — and how a generative UI approach addresses each.

Wall 1: the text wall
Ask a chatbot to analyze ten thousand rows of sales data. You may get many paragraphs of bullets. Human visual processing is vastly faster than reading dense text for pattern tasks. A well-designed chart can communicate in under a second what takes minutes to parse as prose.
What you need instead: an interactive chart with hover detail, drill-down, and date filters.
Wall 2: the linearity wall
Chat is sequential — each message competes for attention. You cannot simultaneously see the sales trend, customer segmentation, and margin analysis in one glance. Analysis is spatial, not only temporal.
What you need instead: a multi-panel dashboard where views sit side by side and update reactively.
Wall 3: the interaction wall
Want Q3 only? You type “filter to Q3.” The agent may regenerate the entire analysis. Want June zoomed? Another message. Compare with last year? Another message. Interactions that should be one click become one sentence, one call, one full rewrite.
What you need instead: native dropdowns, range pickers, and toggles that respond immediately.
Wall 4: the exploration wall
Analysis is non-linear: follow an anomaly, pivot, step back, try another angle. Chat threads are permanent and sequential — you cannot “undo” exploration the way you can in a dashboard’s stateful controls.
What you need instead: interactive state with undo, redo, and branching exploration.
Wall 5: the presentation wall
You found the insight — but the artifact is a long chat thread. That is hard to export as a dashboard or slide-ready story.
What you need instead: exportable dashboards, downloadable charts, and one-click deck generation where the product supports it.
The bottom line: chat optimizes for conversation, not exploration. A2UI is one pathway toward interfaces that match how analysts actually work.
4. A2UI for data visualization: the RizzCharts example
Google already showed an agent-built analytics surface

The agent emits declarative component descriptions. The client renders them as native interactive widgets.
What RizzCharts is
RizzCharts is Google’s official A2UI sample — an AI-powered ecommerce dashboard that demonstrates the generative UI paradigm for visualization. The interaction model differs from chat-first tools:
- User: “show sales breakdown by category” → agent generates an interactive doughnut chart with drill-down, rendered natively.
- User: “were there any outlier stores?” → agent generates a map with highlighted pins and tooltips.
- User clicks a segment → the dashboard drills into sub-categories without a new chat turn.
No code execution in the client from the agent’s bundle, no iframe — declarative JSON rendered as native components. The agent (Gemini plus Google ADK in the sample) fetches data via tools such as get_sales_data and get_store_sales, then constructs A2UI payloads using the surfaceUpdate → dataModelUpdate → beginRendering flow.
Why this matters
The agent is not only analyzing data in text — it is creating an interface the user can explore. Separating structure from state means charts can update reactively when new data arrives. The same JSON can target web, mobile, and desktop surfaces. Custom catalogs can extend A2UI with domain components: financial charts, medical timelines, engineering diagrams, geospatial layers.
The limitation
A2UI is a protocol, not a product. It defines how agents communicate UI — not the cleaning, statistics, chart-type selection, and design reasoning that must happen before the UI exists. A complete visualization workflow still needs an intelligence layer that decides what to show and why.
5. From protocol to product: what a generative UI data platform looks like
A2UI defines transport; intelligence is where value concentrates

A2UI targets the last mile: getting interactive UI from agent to screen. The full pipeline still needs depth beyond transport:

- Data understanding — parse CSV, Excel, JSON, PDF; infer schemas; detect column types; handle encoding edge cases.
- Data cleaning — standardize dates; handle nulls; treat outliers; resolve inconsistencies.
- Statistical analysis — distributions, correlations, trends, anomalies, growth — decide what is interesting.
- Chart selection and design — match chart type to intent; palettes; visual hierarchy; responsive layout.
- Interactive generation — filters, drill-downs, tooltips, motion where it helps comprehension.
- Export and presentation — PPT, PDF, PNG, SVG, or embeds for different audiences.
A2UI helps with how step 5 reaches the client. Steps 1–4 and 6 still require domain intelligence no protocol replaces. That gap is the difference between a standard and a product.
How ChartGen AI implements this philosophy
At ChartGen AI, we have been building on the same generative UI philosophy — not because we ship the A2UI wire format specifically, but because we share the conviction: agents should output interactive visual workspaces, not paragraphs about charts.
Upload data in common formats and describe what you want in natural language. The system aims for an explorable dashboard — not a chat-only answer. Six specialized agents cover the pipeline:

Planning agent
Decomposes the request into sub-tasks and decides which visualizations are needed.
Data cleaning agent
Schema inference, null handling, date standardization, outlier detection.
Data analysis agent
Statistics, pattern detection, correlation analysis, insight generation.
Visualization agent
Chart-type selection, layout, palette, responsive dashboard composition.
Web search agent
External enrichment with benchmarks and market context when relevant.
PPT generation agent
Turns charts and insights into presentation-ready slides with narrative flow.
The output is meant to be a canvas you can click, filter, drill, and export — generative UI applied to data visualization workflows.
The shared philosophy: agent-generated UI beats agent-generated text for data
Whether the transport is A2UI’s declarative JSON or a multi-agent visualization stack, the insight is the same:
For analysis, the right artifact is often an interface, not a paragraph.
- Agent proposes the UI: chart types, layouts, and interactions matched to the dataset — users should not have to micromanage “make a bar chart.”
- Interactive by default: hover, drill, filter — not a static screenshot buried in chat.
- Native quality: the surface should read like a dashboard built for decisions, not like a message with an attachment.
6. The future: what agent-driven interfaces mean for data teams
Three predictions for 2026–2027
Chat-first tools will add generative UI layers. Many analysis products still default to text plus static images. By late 2027, more of them will ship interactive dashboards as first-class outputs — and open standards like A2UI reduce lock-in for how that happens.
Analyst work shifts from building to curating. When the agent composes the dashboard, the human leads with questions, validates insights, and shapes narrative — editorial judgment more than manual chart assembly.
Domain-specific catalogs become a moat. The protocol is open; competitive advantage concentrates in trusted component libraries and domain intelligence — risk heatmaps, cohort views, geo revenue maps, and other specialized primitives teams rely on.
What you can do now
- Developers: experiment with A2UI (v0.8), ADK, and Gemini to build agent-driven surfaces with declarative JSON today.
- Analysts: use tools such as ChartGen AI that already treat dashboards as the primary output.
- Product leaders: evaluate where internal workflows should move from chat-first prompts to UI-first exploration — the ROI shows up in exploration speed and decision quality.
7. Frequently asked questions
What is A2UI?
A2UI (Agent-to-UI) is an open-source protocol from Google that lets agents send declarative JSON describing UI components — forms, charts, maps, dashboards — that clients render with native widgets. Public preview around v0.8 (late 2025) under Apache 2.0.
What is generative UI?
Generative UI means models create layouts and interactive elements dynamically from prompts, rather than only filling fixed templates. A2UI is one protocol aimed at multi-agent and cross-trust-boundary settings.
Why are chatbots weak for data analysis?
They serialize analysis into linear text. Exploration benefits from spatial layout, direct manipulation, and visuals. Common friction includes the text wall, linearity, slow interaction loops, limited exploration state, and weak presentation artifacts.
How do agents produce interactive dashboards?
Protocols such as A2UI carry declarative descriptions of components and bound data. The client renders native controls. Production quality still depends on upstream cleaning, analysis, and design intelligence — not only transport.
What is the difference between A2UI and generative UI?
Generative UI is the broad idea. A2UI is a specific open approach emphasizing declarative data over executable code, portability across clients, and safer collaboration across organizations.
8. Stop reading about your data — start exploring it
The best AI data analysis is an experience, not only a conversation
Google’s A2UI formalizes something practitioners already felt: insights want interfaces — filters, hovers, comparisons — not only paragraphs.
The chat era proved models can understand data. Text is still the wrong default surface for deep exploration: you cannot filter a paragraph, drill into a bullet, or hover a sentence for lineage.
A2UI offers a transport story. Generative UI offers a product philosophy. Multi-agent systems carry the reasoning that decides what to visualize. Together, they sketch the next era: analysis that is interactive, visual, and explorable by default.
Whether you adopt A2UI directly, use platforms that share the philosophy, or build your own — the direction is clear. The future of AI-assisted analysis is not only a chat thread. It is an experience you can navigate.
Try ChartGen AI on your own file: describe the question, verify the numbers against your rows, and explore the canvas instead of rereading the same summary in message form.