

The shift from manual data visualization to AI-powered autonomous chart generation.
Manual chart building used to feel normal: copy data, choose chart type, tweak labels, fight layout settings, and export. In 2026, that workflow is becoming a strategic disadvantage.
When AI agents can produce presentation-ready charts in seconds, the real bottleneck is no longer analysis speed. It is whether teams still spend human time on formatting work that machines now handle better.
From Copilot to Autopilot
The key shift is not just better prompting. It is a change in operating model.
Traditional AI chart tools are reactive. You ask for a chart, then continue handling chart type choices, style cleanup, and iteration manually.
AI agents are proactive. They infer intent, execute a multi-step charting workflow, and refine output quality autonomously.
This changes what "creating a chart" means:
- Before: command-by-command production
- Now: intent-driven orchestration
- Outcome: faster delivery and less decision fatigue for analysts
The 180-Hour Cost of Manual Charting

The hidden cost of manual chart creation adds up to over 4 full work weeks per year.
A common benchmark in 2025 productivity research: analysts spend about 3.5 hours per week on chart formatting tasks alone.
3.5 hours x 52 weeks = 182 hours each year.
That is more than four full work weeks spent on low-leverage visual polish rather than interpretation or recommendation. The cost compounds at team level:
- Executive decisions wait for updated visuals
- Chart quality varies by department
- Senior talent gets pulled into mechanical work
- Important follow-up questions never get explored
From Commands to Conversations

The evolution of data visualization: from manual processes to autonomous AI agents.
The evolution can be summarized in three stages:
Manual era: Human -> Data -> Build -> Format -> Export
AI-assisted era: Human -> Prompt -> Suggestion -> Human refinement
Agent era: Human intent -> Agent reasoning -> Autonomous output
The strongest difference in the agent era is that users describe the question, not the visualization mechanics.
Instead of saying "Build a grouped bar chart with these labels," users can say:
"Why did West region performance drop this quarter?"
The agent can then choose chart forms, annotate anomalies, and deliver a board-ready view in one flow.
A Four-Minute Analyst Workflow
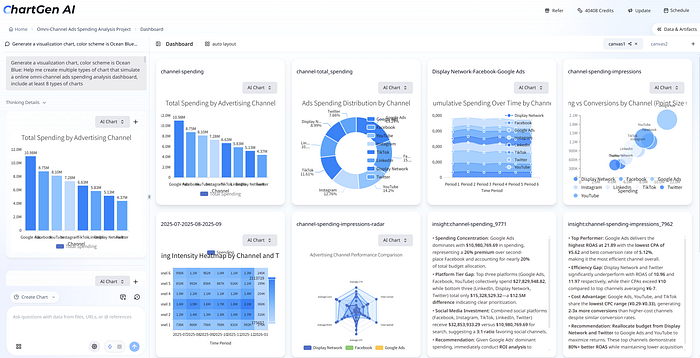
Natural language prompts generate presentation-ready visualizations in seconds.
A practical 2026 workflow looks like this:
- Upload raw CSV or spreadsheet exports
- Ask for the business question, not the chart type
- Receive multiple aligned views (comparison, trend, anomaly)
- Apply brand rules via one instruction
- Export directly to reporting channels
This shifts analyst energy from manual construction to judgment and communication.
Tools like ChartGen AI (https://chartgen.ai/) demonstrate this pattern with natural-language-to-chart generation and rapid iteration loops that remove repetitive formatting work.
Winners and Adapters

AI agents are transforming visualization workflows across every professional role.

Role-based impact of AI agents on charting productivity and decision speed.
The impact shows up across functions:
- Analysts spend less time cleaning chart aesthetics and more time investigating drivers
- Product teams move from dashboard maintenance to faster experimentation
- Executives receive clearer updates with shorter cycle times
Visualization fluency is also being democratized. Teams no longer need deep chart-tool expertise to get high-quality outputs quickly.
Skeptic Questions, Practically Answered
Common concerns remain valid, but they are increasingly manageable in modern tools:
- Nuance: agent quality improves when prompts include audience and business context
- Control: natural-language edits are usually faster than manual menu operations
- Security: enterprise deployment options and governance controls are now baseline requirements
- Brand fit: reusable style rules can enforce typography and color standards consistently
AI does not replace data literacy. It amplifies analysts who ask better questions and validate answers thoughtfully.
How to Start in 30 Seconds
- Pick one recurring report that your team rebuilds every week or month
- Recreate one existing chart using an agent workflow
- Compare speed, consistency, and stakeholder clarity
- Evaluate tools on language understanding, integrations, exports, and security fit
If your team currently spends more time formatting than interpreting, this is usually the highest-leverage workflow upgrade available.
The Chart That Builds Itself
The real promise is not prettier charts. It is reclaimed analyst capacity.
When chart execution becomes autonomous, people can spend more time on strategic thinking, cross-functional alignment, and decision support.
The question is no longer whether AI can build your charts.
The question is whether your workflow is ready to let it.
Key Takeaways
- Manual chart formatting creates a measurable annual productivity drag
- Agent workflows replace command-by-command chart construction with intent-first execution
- Faster visualization loops improve decision speed, not just output volume
- Human value shifts toward framing, validation, and communication