
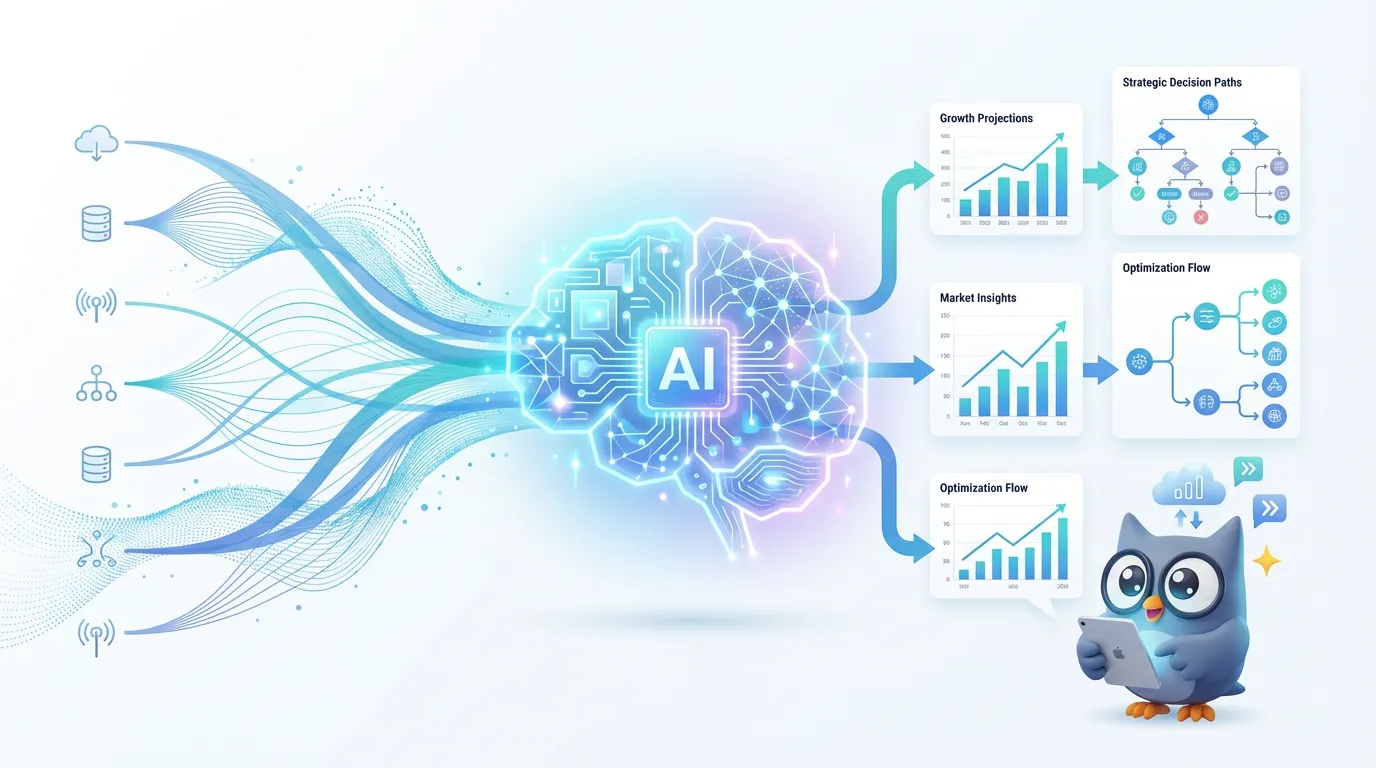
ChartGen AI turns fragmented data inputs into actionable decision outputs.
For decades, business decisions followed a familiar loop: request data, wait for analysts, review reports, discuss, then decide.
That process optimizes for control, but often fails on speed.
In fast-moving markets, a one-day lag can mean missed revenue, delayed response, or higher risk.
The Traditional Decision Bottleneck

Traditional reporting creates delayed and fragmented decision flow.
In many organizations, even simple business questions pass through multiple roles:
- Business analyst
- Data analyst
- Data product manager
- Data engineer
Each handoff adds time and interpretation cost. The result is often T+1 decisions built on filtered context rather than direct, shared understanding.
Why This Pipeline Breaks at Scale

Multi-layer handoffs increase bias and reduce decision speed.
As teams scale, reporting complexity grows faster than decision quality:
- More dashboards
- More chart requests
- More manual formatting and interpretation work
- Less confidence in what matters first
When analytics stays gatekept by process, organizations move slower than their data.
ChartGen AI as a Decision Partner
ChartGen AI changes the workflow from "request and wait" to "ask and act."
Instead of asking someone to pull weekly sales by region, teams can directly ask:
"What caused yesterday’s sales drop in the East region?"
Within one flow, ChartGen AI can:
- Retrieve data
- Generate charts
- Analyze trends
- Flag anomalies
- Explain likely causes
- Summarize next-step insights
This shift does not just save time. It broadens who can use data confidently.
Retail Example: Fast Insight, Faster Action

Real-time monitoring helps teams detect and react to regional changes.
In retail operations, delayed reporting usually means problems are discovered after loss is already visible.
With ChartGen AI:
- Sales updates can be monitored in near real time
- Dashboards are generated automatically
- Abnormal patterns are surfaced immediately
When one region drops, teams can immediately inspect likely drivers such as conversion decline, inventory gaps, campaign shifts, or local demand changes.
From Dashboard-Centered to Insight-Centered

Teams move from static dashboards to guided, insight-first analytics.
The core value is not just chart creation. It is interpretation attached to visualization.
Instead of "Here is a chart," teams get "Here is what changed and what to review next."
That reduces the distance between data, insight, and action.
Final Thoughts
Business teams no longer suffer from lack of data. They suffer from slow interpretation loops.
ChartGen AI helps close that gap by combining visualization, analysis, and explanation inside one workflow that decision-makers can use directly.
The next phase of business intelligence is not about producing more reports. It is about understanding faster and acting earlier.
Key Takeaways
- Traditional analytics workflows delay decisions through role handoffs
- ChartGen AI compresses data-to-decision time in a single flow
- Real-time charting plus interpretation improves action quality
- Insight-centered systems scale better than dashboard-heavy reporting