



A technical diagram can become confusing before the drawing even begins. The problem is usually not the software itself, but an unclear system description filled with too many components, undefined connections, and mixed levels of detail.
Consider a simple file-processing workflow. A user uploads a file through a web application, and a validation service checks whether the file is valid. Valid files are stored in a database before the application returns a success response. Invalid files trigger an error response instead.
Even this basic process can become difficult to follow once internal modules, external services, storage systems, and exception paths are added. Without a clear structure, the diagram may show all the correct elements while still failing to explain how the system works.
A technical diagram maker can turn these relationships into a clearer visual structure and reduce the manual work involved in arranging nodes and connectors. However, the tool still needs an accurate description of the system and how each part is connected.
The aim is not to place every technical detail on one page. A useful diagram should answer one main question and present the system at a consistent level of detail.
Why Technical Diagrams Become Hard to Read?
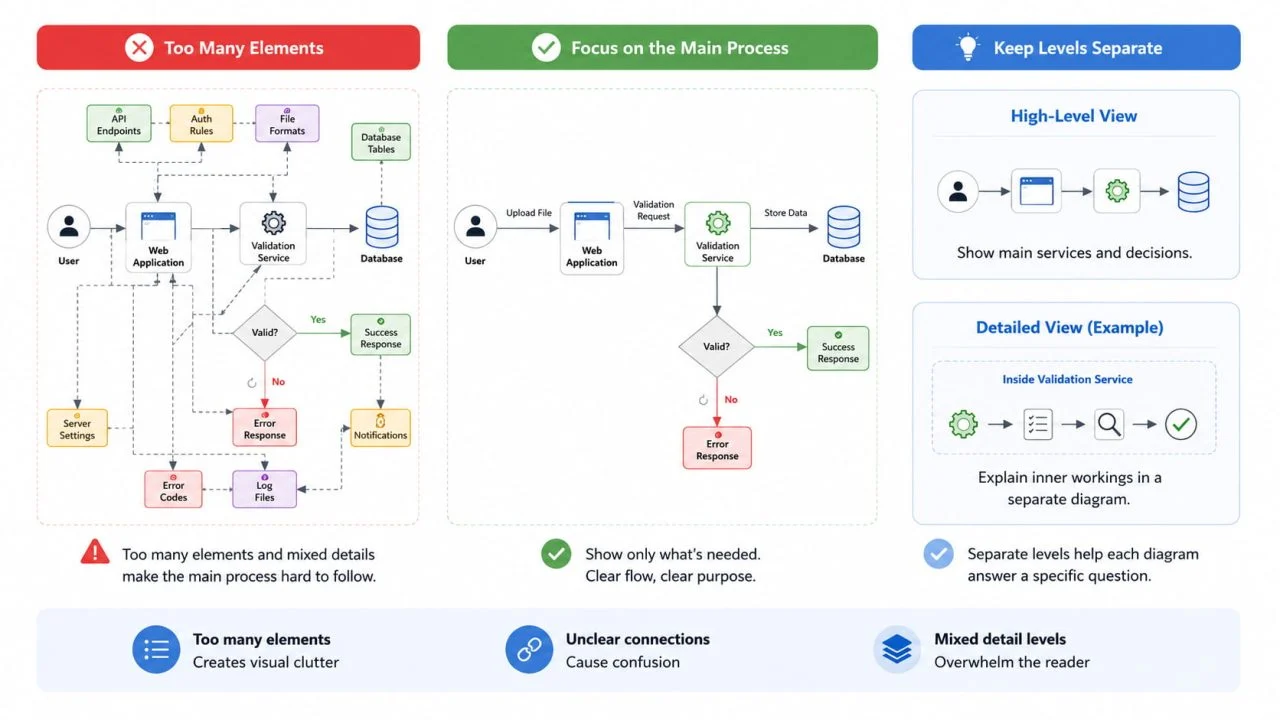
Technical diagrams usually become difficult to understand because they contain too many elements, unclear connections, or several levels of technical detail in the same view.
In the file-processing example, the main diagram may only need to show the user, web application, validation service, decision point, database, success response, and error response. If the same diagram also includes API endpoints, database tables, authentication rules, file formats, server settings, and individual error codes, the main process becomes much harder to follow.
Connections can also create confusion. An arrow between the web application and validation service shows that the two components communicate, but it does not explain what is being sent or why the connection exists. A short label such as “uploaded file,” “validation request,” or “validation result” gives the relationship a clearer purpose.
Another problem appears when a diagram mixes broad system stages with highly detailed technical operations. A high-level diagram can show the main services and decisions, while a separate diagram explains what happens inside the validation service. Keeping these levels separate allows each diagram to answer a specific question without overwhelming the reader.
What to Prepare Before Creating the Diagram?
A diagram tool can organize information, but it cannot automatically correct an unclear system description. Before using a technical diagram maker, define the purpose of the diagram, identify the main nodes, and describe the process in plain language.
Define One Main Question
Every diagram should answer one clear question. For the file-processing system, that question might be: “How does an uploaded file move through validation, storage, and final response?”
This question determines what belongs in the diagram. Information about user permissions, server configuration, or detailed database structure may still be important, but it does not need to appear unless it helps explain the main workflow.
Defining the question first also prevents the diagram from becoming a general collection of everything related to the system. Each node and connector should contribute directly to the explanation.
Identify the Core Nodes
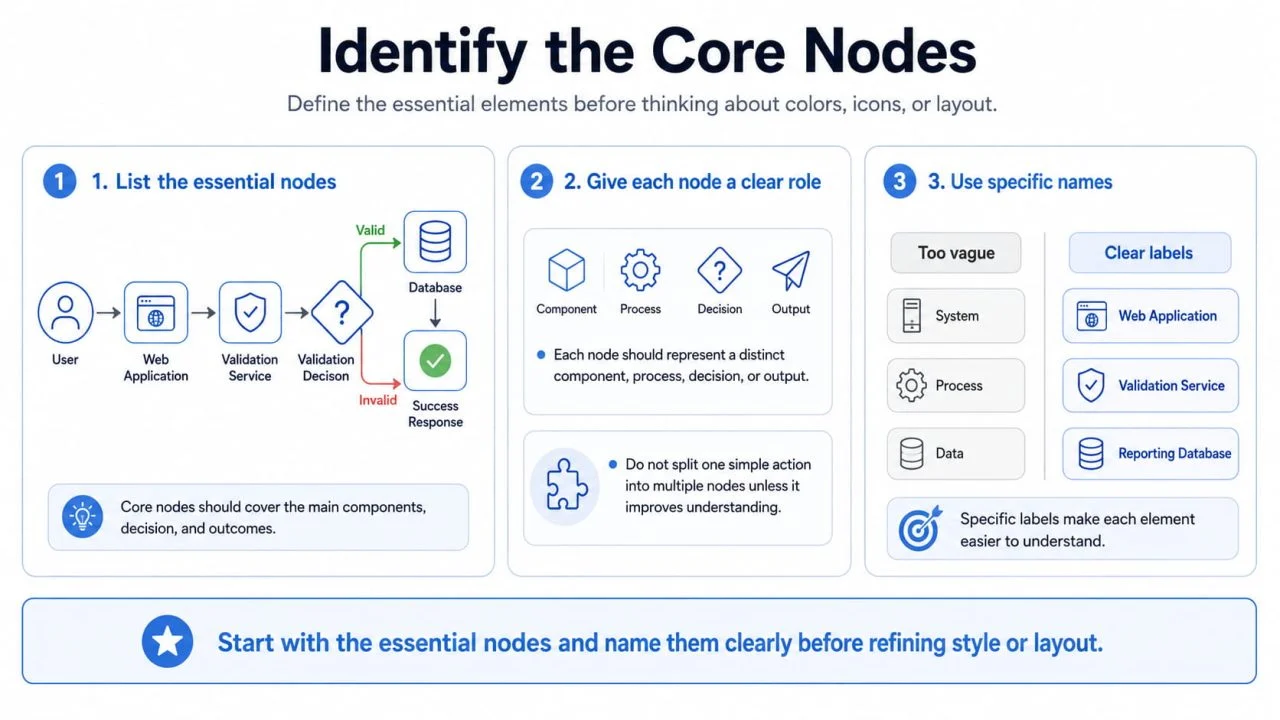
Write down the essential elements before thinking about colors, icons, or layout. In this example, the core nodes are the user, web application, validation service, file-validation decision, database, success response, and error response.
Each node should represent a distinct component, process, decision, or output. One simple action should not be divided into several nodes unless that separation helps readers understand an important part of the system.
The node names should also be specific. Labels such as “System,” “Process,” or “Data” provide too little information. Names such as “Web Application,” “Validation Service,” and “Reporting Database” make the role of each element easier to understand.
Describe the Flow in Plain Language
Before generating the diagram, explain the process in a short paragraph. For example, the user uploads a file through the web application, which sends the file to the validation service. If the file is valid, it is stored in the database, and the web application returns a success response. If the file is invalid, the application returns an error response instead.
This description gives the diagram a clear sequence. It also helps a visual diagram generator distinguish between system components, actions, decisions, and outputs.
A vague request such as “create a diagram for a file system” leaves too many relationships undefined. A precise description gives the tool a much stronger foundation for the initial layout.
How to Build a Clear Block Diagram?
A block diagram maker works best when the process has been divided into clear functional stages. Each node should have a specific role, while the connectors should show how information or actions move through the system.
Start with the Main Process
Begin with the simplest version of the workflow. The user sends the file to the web application, the application sends it to the validation service, and the validation result determines what happens next.
When the file is valid, it moves to the database. The database returns the stored result to the web application, which then sends a success response to the user. When the file is invalid, the validation result returns to the web application, which sends an error response.
This structure keeps the responsibilities clear. The database stores and returns information to the application, while the application remains responsible for communicating with the user.
Additional components should support this main process rather than compete with it. If a service does not help explain the primary flow, it may belong in a more detailed supporting diagram.
Add Decision Paths Carefully
Decision points should appear when they change the direction of the workflow. In this example, “Is the file valid?” is essential because the answer determines whether the file is stored or rejected.
The two outcomes should be labeled clearly so the reader can understand the successful and failed paths without tracing several connectors.
Not every technical exception needs its own branch. Showing all possible server errors, timeout conditions, and validation messages may make the diagram more complete, but it can hide the main logic. Minor exceptions can remain in supporting documentation unless they significantly change the process.
Keep the Layout Consistent
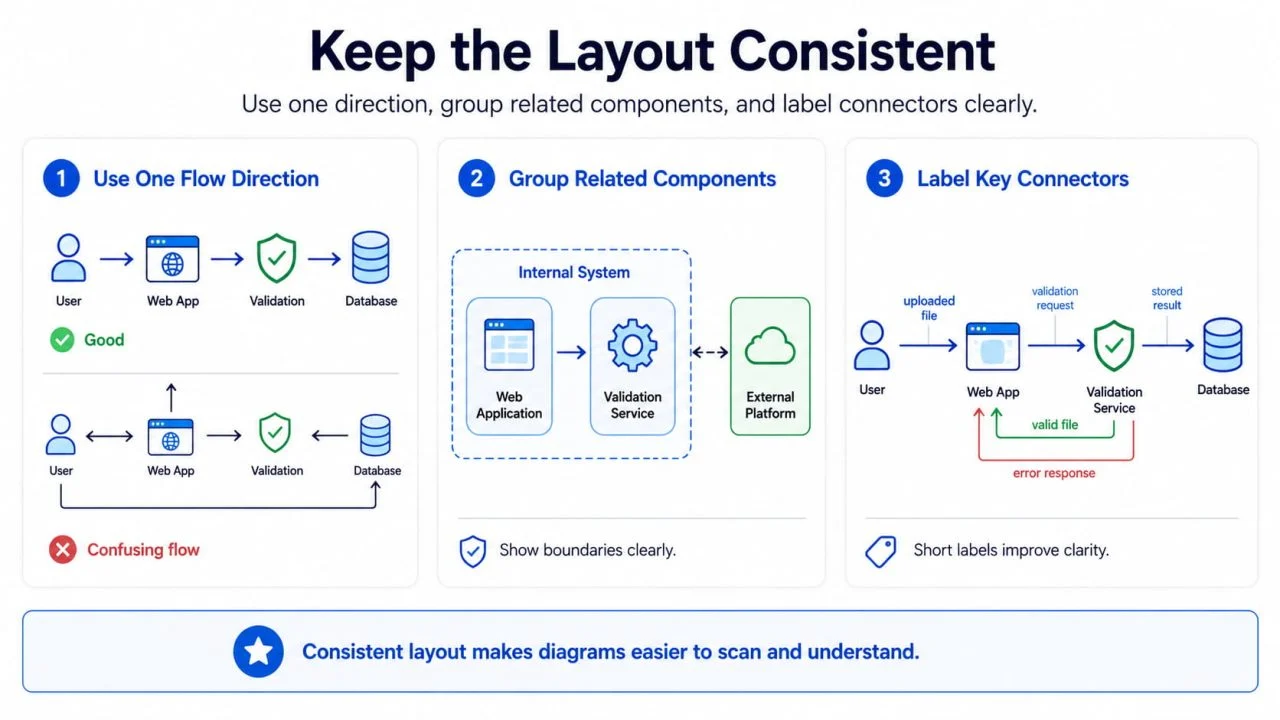
A left-to-right layout works well for a sequential workflow because the reader can follow the process in one direction. A top-to-bottom structure may be more suitable for a hierarchy or system architecture.
The specific direction matters less than consistency. A diagram becomes difficult to scan when the main flow moves left to right, then upward, and then back across the page.
Related components should also appear close together. The web application and validation service may belong inside an “Internal System” section, while a third-party platform should appear in a clearly separated external area. This grouping helps readers understand system ownership and boundaries.
Important connectors should use short labels that explain what moves between the nodes. Labels such as “uploaded file,” “validation request,” “valid file,” “stored result,” and “error response” remove ambiguity without filling the diagram with long descriptions.
How a Smart Diagram Tool Supports the Process?
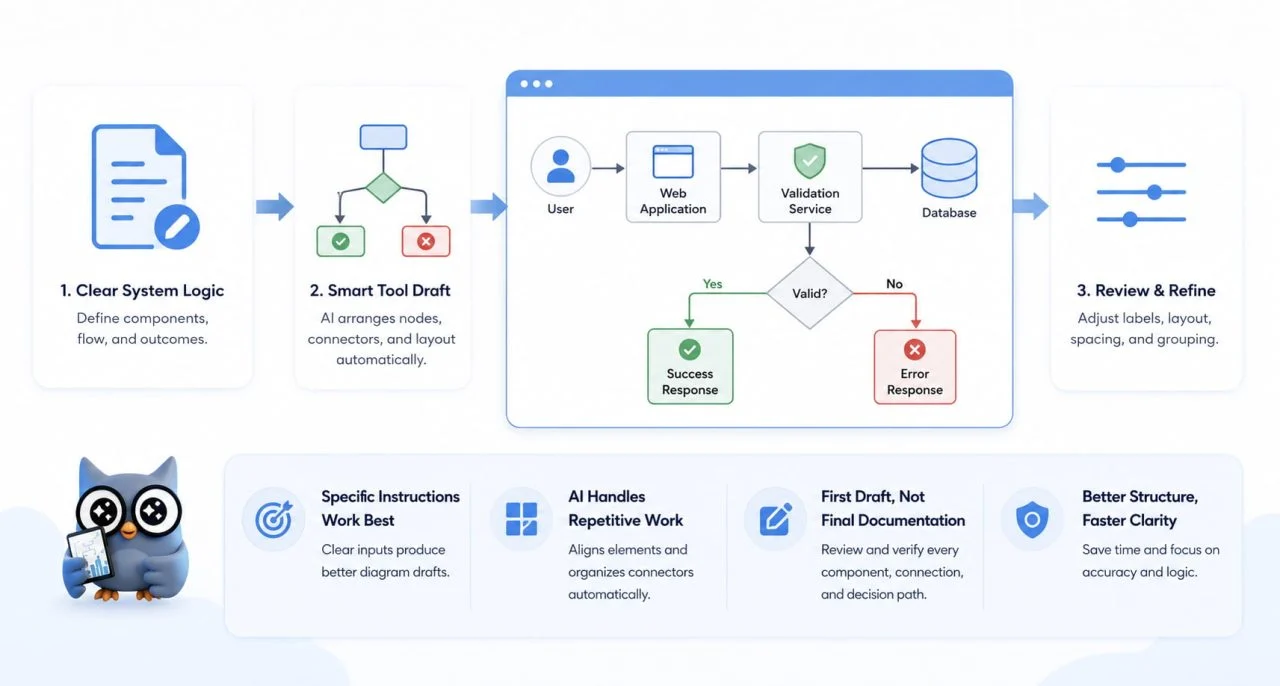
Once the system logic is clear, a smart diagram tool can handle much of the repetitive layout work. It can help arrange nodes, align elements, and organize connectors without requiring every shape to be positioned manually.
A specific instruction usually produces a better draft than a broad request. For example, asking for a left-to-right diagram that shows a user uploading a file through a web application, sending it to a validation service, storing valid files in a database, and returning either a success or error response gives the tool a defined structure.
This instruction identifies the main components, decision point, layout direction, successful outcome, and failed outcome. By contrast, a general request to “create a technical diagram” does not explain enough about the relationships between the elements.
ChartGen AI’s AI Diagram Maker can help turn a clear system description into an initial diagram structure. The generated version can then be reviewed and adjusted to improve labels, direction, spacing, and component grouping.
For technical use, the first generated diagram should be treated as a structural draft rather than finished documentation. The user still needs to confirm that every component is real, every connection is accurate, and every decision path matches the actual system.
Common Problems to Check
A diagram can look polished while still containing unclear or incorrect logic. One common problem is the use of vague node names. Readers should not need to guess what a block called “Service” or “Process” actually does.
Crossing connectors are another warning sign. They often indicate that the nodes need to be repositioned or that too many relationships are being shown in one view. If rearranging the layout does not solve the problem, dividing the content into a high-level overview and a detailed supporting diagram may be more effective.
Missing return paths can also create incorrect system logic. In the file-processing example, the database should not appear to communicate directly with the user. It returns the stored result to the web application, which then sends the final response. Showing this return path keeps the responsibilities of each component clear.
Finally, avoid including technical details simply because they are available. A complete diagram is not always a useful diagram. Any node, label, or connector that does not help answer the main question should be removed or moved into a separate view.
Final Review Before Sharing the Diagram
Before sharing the diagram, follow the workflow from the first user action to the final response as though you were seeing the system for the first time. Check whether each component has a clear role, whether the connectors follow the real direction of the process, and whether the labels explain what moves between connected nodes.
The successful and failed paths should be easy to distinguish. Internal services, external platforms, decisions, and outputs should not appear as though they perform the same function. Any detail that does not support the main workflow should be removed or placed in a separate technical diagram.
A technical diagram maker is most effective when the system has already been reduced to clear nodes, accurate connections, and one consistent flow. An AI Diagram Maker can speed up the initial arrangement, but the generated structure still needs to be reviewed by someone who understands how the system actually works.
The final diagram does not need to include every technical detail. It only needs to show the information readers require to understand the system without additional explanation.