


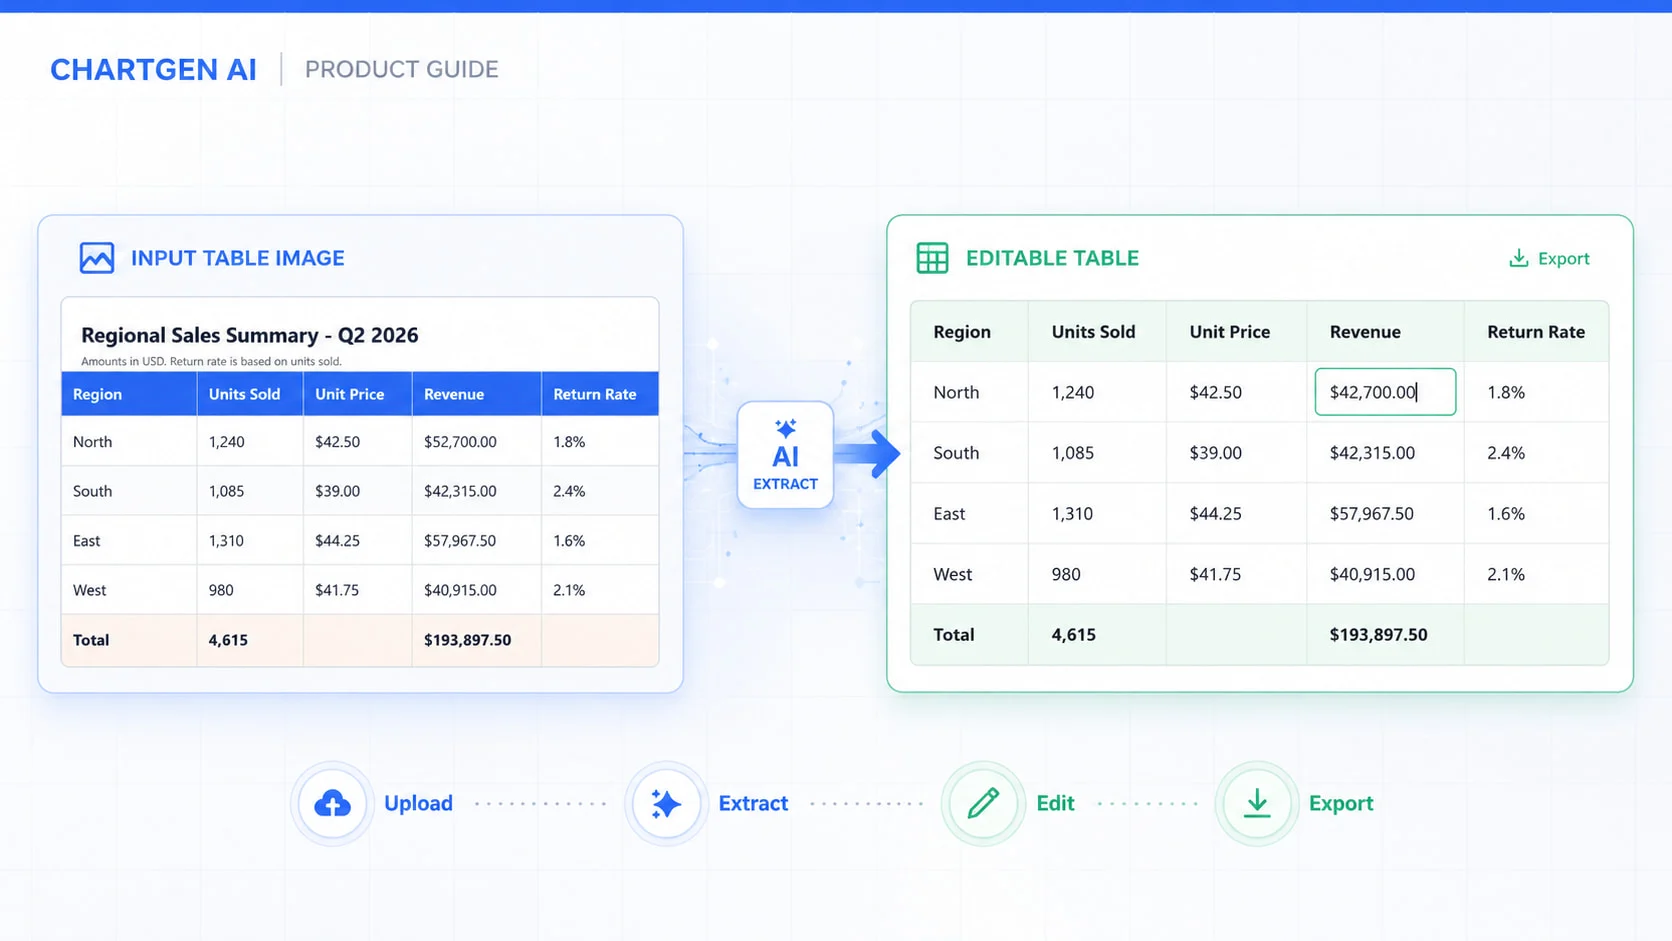
A table screenshot can be easy to read and still be difficult to use. You cannot sort the rows, check a total, or calculate with the values while they remain locked inside an image.
ChartGen AI Image to Table converts table images into editable rows and columns. This shows how to prepare an image, prompt the tool, review the result, and export the data. In August 2026, we tested the tool with a regional sales table for Q2, covering units sold, unit prices, revenue, and return rates across four regions.
Before You Start: Choose the Right Tool
Use an image to table converter when the source already contains rows and columns. Examples include a report screenshot, photographed price list, scanned form, or dashboard table.
Use AI Image to Chart when the source is a bar chart, line chart, pie chart, or another visualization. That tool needs to interpret axes, legends, labels, and plotted marks.
For this workflow, the source must be a table image rather than a chart screenshot.
How to Extract a Table from an Image with ChartGen AI?
Step 1: Prepare the Table Image
Start with the clearest version of the file. A direct screenshot is usually easier to extract than a compressed message attachment or an angled phone photo.
Before uploading, check that:
- The complete table is visible, including headers and totals.
- Text is readable at normal zoom.
- The image is upright and not heavily skewed.
- Decimal points, minus signs, percentages, and currency symbols are clear.
- Unrelated text is cropped when it could be mistaken for table content.
Keep notes that affect the meaning of the values. Do not remove text such as "figures in thousands" or "parentheses indicate negative values."
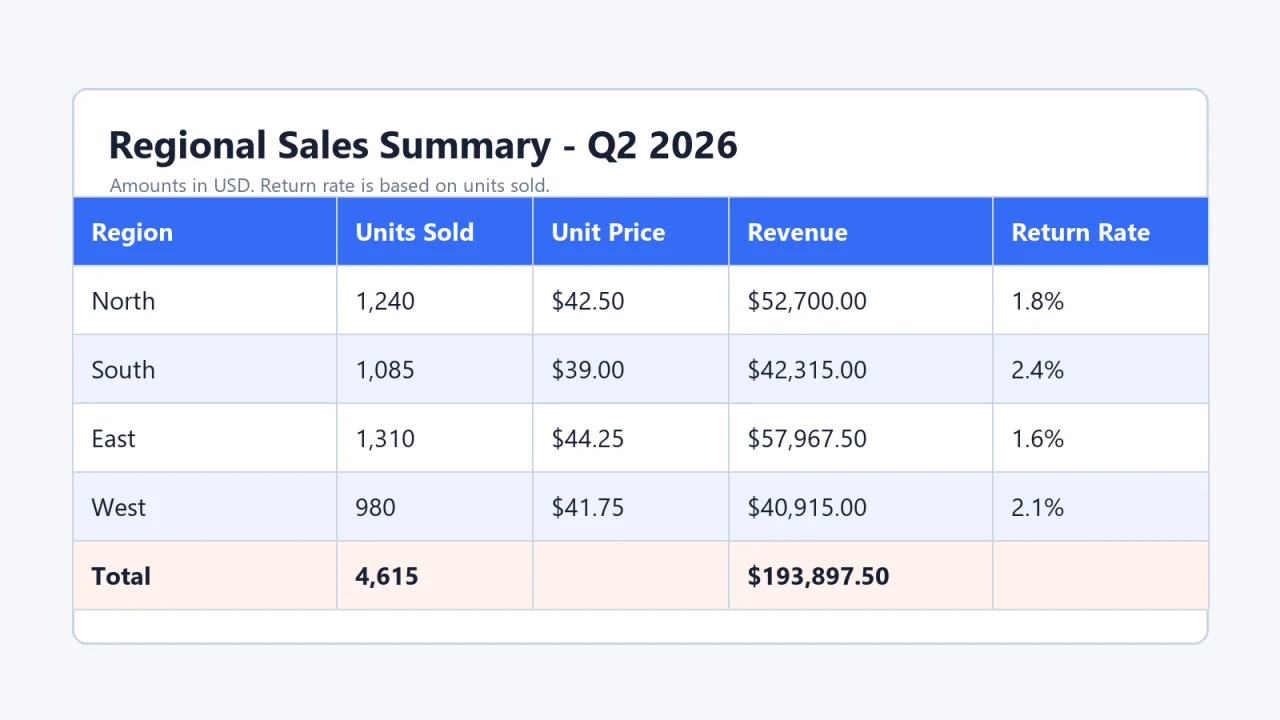
For our test, we created the table below. It contains five columns: currencies, percentages, thousands separators, two blank cells, and a Total row.
Step 2: Upload the Image
Open ChartGen AI Image to Table and upload the original PNG, JPG, GIF, or WebP file.
If the image contains customer, financial, or employee information, check your organization's data rules first. ChartGen states that uploaded files are deleted automatically after 24 hours.
Uploading our test image did not start extraction automatically. ChartGen recognized the file and asked what we wanted to do. The interface suggested charts, dashboards, reports, Excel export, and calculations.
Step 3: Tell ChartGen Exactly What to Extract
A precise instruction keeps the task focused on table extraction. It also tells ChartGen which details must remain unchanged.
Prompt used in our test:
"Extract the table from this image exactly as shown. Preserve the original column headers, row order, currency symbols, thousands separators, decimal places, percentages, blank cells, and the Total row. Do not create a chart, dashboard, or analysis. Return the result as an editable table, then provide options to export it as Excel and CSV."
For a simpler source, shorten the prompt. Keep any requirement that matters to your data, such as leading zeros, negative values, blank cells, or date formats.
Step 4: Review the Extracted Table
Do not start by checking random cells. Confirm the structure first, then review the values.
Check the structure
Make sure ChartGen selected the correct header row. Check that adjacent columns remain separate and that notes outside the table did not become data rows.
Merged headings, multi-line labels, and two tables placed close together deserve extra attention.
Check high-risk values
Compare the result with the source image. Focus on:
- Dates that can be read in more than one format.
- IDs and product codes with leading zeros.
- Percentages that may have lost the percent sign.
- Parentheses used for negative numbers.
- Currency symbols placed in separate cells.
- Blank cells that should remain blank.
In our controlled test, ChartGen preserved all headers, values, symbols, blanks, and the Total row. Units Sold added to 4,615. Revenue added to $193,897.50, matching the source.
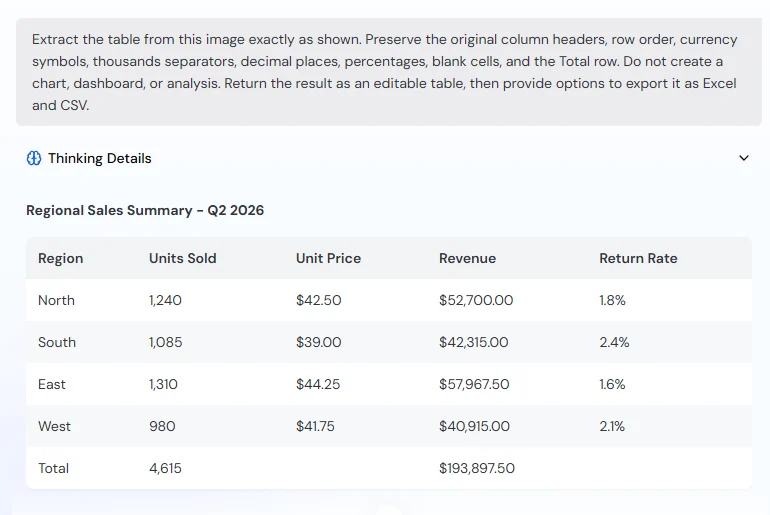
This was a clean, high-resolution image. Scans, handwriting, phone photos, and complex headers may produce different results.
If the extracted table needs new columns or calculations, ChartGen's structured Excel table guide includes prompts for cleanup, formatting, and formulas.
Step 5: Export to Excel or CSV
Choose Excel when people will continue editing the workbook. Choose CSV when the data will move into a database, script, or analytics tool.
In our test, ChartGen displayed two export cards labeled Excel. Opening a card showed Free and Subscribed download options. The free option warned that the download would include a ChartGen AI watermark.
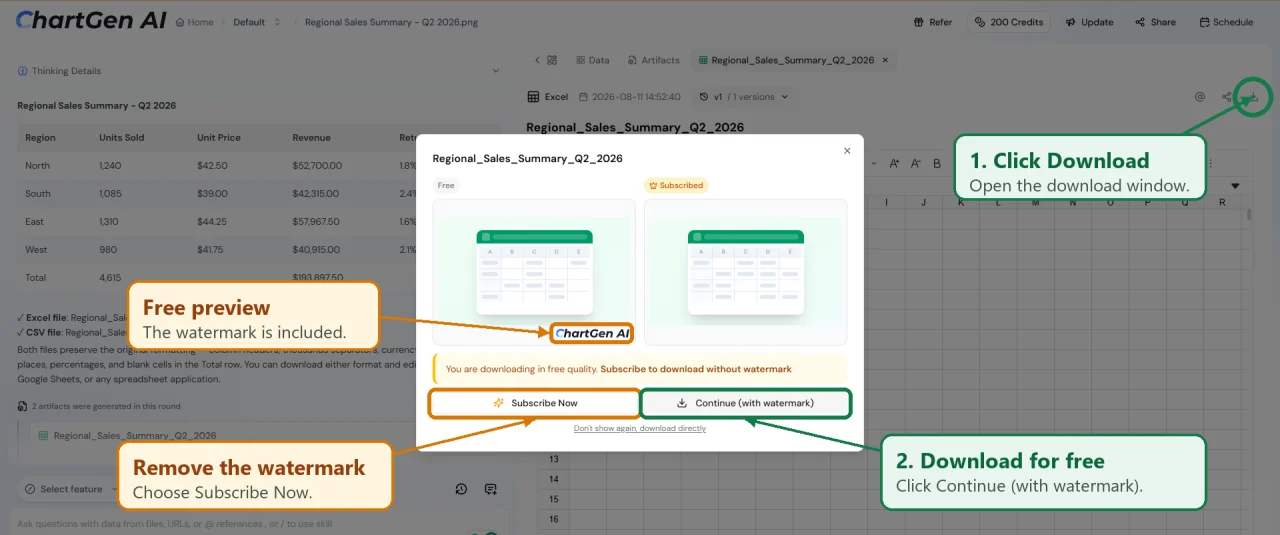
The first free download produced a CSV file, even though the card was labeled Excel. A later download produced a native XLSX workbook. We checked both files rather than relying on the labels in the interface.
What We Found in the August 2026 Test
The product page describes XLSX export as preserving formatting and providing formula-ready cells. The workbook downloaded during this test was editable, but it did not match that description. Currency, percentage, Revenue, and Units Sold values used General formatting and were stored as text.
The strongest result was accurate transcription. The main limitation was spreadsheet readiness.
Verify the Export Before You Use It
A table can look correct while still containing text values that fail in formulas. Before using the export:
- Compare the number of rows and columns with the source.
- Recalculate one subtotal or total.
- Check the largest, smallest, and negative values.
- Test whether one currency, percentage, and quantity cell behaves as a number.
- Compare cells from the top, middle, and bottom of the table.
A matching total is useful evidence, but it does not prove that every cell is correct.
Excel or CSV: Which Format Should You Choose?
Neither format repairs an extraction mistake. An XLSX extension also does not guarantee that displayed numbers use numeric cell types.
When Is Image to Table Useful?
Use Image to Table when the original spreadsheet is unavailable but the information is visibly tabular.
A finance team may need figures from a report screenshot. A researcher may have a photo of a printed table. An operations team may need a dashboard grid for a presentation. A sales team may receive a supplier price list as an image.
If the original Excel, CSV, or selectable HTML table is available, import that file instead. It preserves more information and avoids an unnecessary extraction step.
The Practical Takeaway
ChartGen removed the need to retype the test table. The values in our clean source image were extracted accurately and remained editable.
The exported workbook still needed preparation before analysis. Treat the output as recovered data, not verified evidence.
To follow the same workflow with your own screenshot, photo, or scan, try ChartGen AI Image to Table. Upload, instruct, compare, correct, and then calculate.